LENS
Intelligence Analysis · Risk Intelligence Series

The US AI Data Center Industrial Complex

Read it your way

The report reads the same for everyone — your lens changes what each finding means for your capital, covenants, coverage, or uptime. Read it online through one of four lenses (or none), have it emailed to you, or download the full PDF.

Read online

Pick the lens that matches your role — switch anytime as you read.

Get it sent to you

Prefer it in your inbox? Opt in and we’ll email you the report.

Download the PDF

Prefer the original format? Get the complete report as a PDF — 480+ sources, ungated.

Download the report →
AUTHORSJosé María Seara · Donovan Tindill · Neil Arklie · George Mawdsley
FOREWORD BYBill Kleyman
AUDIENCEInvestors · Lenders · Insurance & Reinsurance
RESEARCH BASE480+ primary and secondary sources
PUBLICATION DATEJuly 2026
DeNexus, Inc. · denexus.io — This analysis is provided for informational purposes. It does not constitute investment, legal, or insurance advice. All rights reserved © 2026 DeNexus, Inc.
FOREWORD

Foreword — Bill Kleyman guest foreword; Four Vantage Points. One Conclusion.

THROUGH YOUR LENS · DATA CENTER OPERATOR

Four vantage points, one conclusion — and yours is the one closest to the physical infrastructure this analysis is about. The foreword frames why the operating layer is where the systemic story starts.

THROUGH YOUR LENS · PE INFRA INVESTOR

The foreword sets the frame: four capital-market vantage points converge on the same blind spot. Read it as the thesis statement for the diligence questions raised throughout.

THROUGH YOUR LENS · LENDER

One conclusion across four vantage points — for debt providers, the foreword frames why the risk sitting under your collateral has not been priced into the structures financing it.

THROUGH YOUR LENS · INSURER / REINSURER

The foreword frames the market context this paper writes into: coverage capacity is moving fast, and the vantage points converge on the layer no program has resolved.

Foreword

From the Data Center and AI Infrastructure Side

I have spent more than two decades working across enterprise technology, cloud, cybersecurity, critical infrastructure, and now industrial AI. Today, as Executive Chair of Data Center Programs at Informa and CEO and Co-Founder of Apolo.us, I sit at the intersection of operators, builders, technology providers, capital partners, and the communities being asked to support this extraordinary expansion. From that vantage point, one thing is clear: AI is not simply increasing demand for data centers. It is fundamentally changing what a data center is.

We often talk about GPUs, megawatts, liquid cooling, and speed to capacity. But behind every breakthrough in compute is a growing chain of physical dependencies. Power systems, substations, turbines, chillers, pumps, building controls, water infrastructure, fuel supply, and telecommunications must all work together, every second of every day. As density and complexity increase, the distance between a minor disruption and a major operational event becomes remarkably small.

The uncomfortable truth is that you cannot scale AI responsibly if you do not understand what can stop it. A facility may have world-class IT security while the operational systems controlling power and cooling remain poorly monitored, insufficiently segmented, or inadequately understood. In this environment, a cyber event is no longer limited to compromised data. It can stop pumps, trip chillers, interrupt generation, damage equipment, and create cascading consequences across customers, communities, insurers, investors, and the grid itself.

That is why this memo matters. The industry does not need more fear. It needs better visibility, stronger engineering, and a credible way to translate operational risk into financial terms. If AI infrastructure is becoming one of the most important industrial systems of our generation, then resilience cannot be something we bolt on later. It must be designed, measured, financed, and continuously improved from the very beginning.

The View from Four Seats

Four Vantage Points. One Conclusion. This analysis was written by four people who have spent their careers at the intersection of industrial infrastructure, cyber risk, and the capital markets that finance and insure it. We came at it from different directions. We arrived at the same place.

From the operational side. Jose spent three decades founding, scaling, and operating critical infrastructure companies — power generation, transmission, industrial control environments. He built NaturEner from a start-up concept into a $100M+ annual revenue business in under ten years. That experience was built in the field — not in spreadsheets. Jose knows what a turbine control room looks like at two in the morning when something goes wrong. He knows how long it takes to bring a generating asset back online after an unplanned trip. He knows the difference between a system that is theoretically protected and one that is operationally hardened. When Jose looks at what is being built across the United States today under the banner of AI infrastructure, he recognizes the physical DNA immediately — and recognizes the gap between how the market is pricing this asset class and what the industrial reality actually demands. These are not server buildings. They are industrial energy campuses, and they carry every risk that designation implies.

From the OT security side. Donovan has spent 25 years inside ICS and OT environments — not as an observer, but as a practitioner. He is a contributing author to IEC 62443, the international standard for industrial control system security. He was Vice-Chair of the CISA ICS Joint Working Group (ICSJWG) 2016-2023 — which means he helped organize thought leadership for one of the largest government-sponsored ICS/OT cybersecurity industry conferences – bringing together the pioneers in OT security. His years at Honeywell gave him deep familiarity with the exact categories of hardware — turbine DCS, SCADA, PLCs — that now form the operational backbone of the AI data center ecosystem. What Donovan brings to this analysis is not theoretical analysis of OT risk. It is a practitioner's understanding of what these systems actually look like on the inside, where their real vulnerabilities sit, and why the standard security frameworks applied to IT environments fail to address them.

From inside the insurance market. Neil has spent 30 years in cyber insurance — including as Head of Cyber at Lloyd's of London, at Aviva, and at Swiss Re. He has sat on the underwriting side of the table for longer than most of this sector's current risk managers have been in the industry. He knows, with precision, where standard cyber policies actually end — not where the marketing materials say they end, but where the policy language breaks down when a claim is presented for an OT event. The war exclusion problem, the physical-cyber boundary disputes, the BTM generation gap, the BI definitions that were never written to contemplate an AI data center interdependency scenario — these are not abstract coverage questions to Neil. They are decisions he has made and seen made, across hundreds of placements, over three decades at the frontier of a market that is now being asked to underwrite risks it has not yet priced. His contribution to this analysis is the honest assessment of where the coverage actually stands — and what it would take to close the gap.

From the capital markets side. George spent a decade originating Insurance-Linked Securities at Securis and before that underwriting special risks at Lloyd's of London through Hiscox. His professional life has been spent at the point where industrial risk meets structured capital — where the question is not whether a risk exists, but whether it can be quantified well enough to be transferred. What George understands, from experience, is what happens when capital is deployed against a risk that has not been properly modeled: the exposure is retained without knowing it, the covenant is breached without anticipating it, and the loss event is absorbed by a balance sheet that was never sized to hold it. The financial risk analysis in this analysis — the CapEx compression, the FCF collapse, the lender exposure to unmodeled OT tail risk — reflects his lens.

That gap is what this analysis is about.

The numbers we present are not projections from optimistic models. They are facts drawn from 451 published sources — regulatory filings, insurance market analyses, threat intelligence reports, earnings calls, and engineering studies. The risks we describe are not hypothetical. Nation-state actors have been confirmed inside US industrial control systems directly adjacent to the data center power chain. Seventy-five percent of building management systems carry known exploitable vulnerabilities, many linked to active ransomware campaigns. Fewer than 10% of OT environments have any monitoring in place to detect an attack before it causes physical damage. And the financial community has, so far, priced the opportunity with impressive precision and the risk with almost none.

Between us, we bring more than 95 years of combined experience in critical infrastructure operations, OT cybersecurity, cyber insurance, and industrial risk capital. What we share — beyond that accumulated experience — is the conviction that this risk is real, that it is measurable, and that the window to act before a significant event forces the conversation is narrowing faster than the market appreciates.

This analysis is the start of that conversation.

José María Seara
Founder & CEO, DeNexus

30+ years founding, scaling, and exiting technology and critical infrastructure companies. Built NaturEner from start-up concept to $100M+ annual revenue in under 10 years. M.Sc. Naval & Marine Engineering, Polytechnic University of Madrid.

Donovan Tindill, CISSP, GICSP
Sr. Director OT Cybersecurity, DeNexus

25+ years ICS/OT security. Contributing author and trainer of 62443. Vice-Chair, industry conference leader. Former Honeywell.

Neil Arklie
Head of Insurance Solutions, DeNexus

30+ years cyber insurance. Former Head of Cyber at Lloyd's of London and Aviva. Former Swiss Re. The insurance market analysis in this analysis reflects decades of placement and underwriting experience at the market's frontier.

George Mawdsley
Head of Risk Solutions, DeNexus

10 years ILS origination at Securis. Former Lloyd's special risks underwriter at Hiscox. Bridges the gap between industrial risk quantification and capital markets — the lens through which the financial risk sections were written.

SECTION 00

Executive Summary

THROUGH YOUR LENS · DATA CENTER OPERATOR

The headline numbers land on your floor: 75% of building management systems carry known exploitable vulnerabilities, and fewer than 10% of OT environments have monitoring capable of detecting an attack in progress. The buildout that funds your growth is also expanding the attack surface you operate.

THROUGH YOUR LENS · PE INFRA INVESTOR

$660–725B in committed 2026 CapEx and a projected $1T+ in 2027 — this is the asset class you are deploying into. The exec summary’s counterweight: the OT layer of these assets carries an 82–94% protection gap.

THROUGH YOUR LENS · LENDER

Hyperscalers have issued over $100B in bonds to fund the buildout while nation-state actors are confirmed pre-positioned in the adjacent power infrastructure. The exec summary frames the credit question: what part of the collateral’s risk is uninsured?

THROUGH YOUR LENS · INSURER / REINSURER

Four dedicated programs launched or expanded between June 2025 and April 2026, and S&P projects $10B in new DC premiums in 2026 — yet the summary’s core finding is that none has resolved the OT layer. BTM power generation OT has no policy form, no actuarial data, no placement path.

The United States is in the middle of the largest industrial infrastructure buildout since the interstate highway system. The trigger is artificial intelligence and the race to be the global leader. The vehicle is the data center. And the systemic risk — the one that financial markets, insurance products, and lender covenants have not yet priced — is operational technology (OT) cyber risk embedded throughout the industrial infrastructure that powers, cools, connects, and sustains these facilities.

$690B+
Big 5 hyperscaler CapEx in 2026 alone — nearly double 2025 levels
$7.6T
Goldman Sachs cumulative AI infrastructure CapEx projection, 2026–2031
75%
Of data center building management systems have known exploitable vulnerabilities
<10%
Of OT environments have active monitoring to detect an attack in progress

The opportunity is real. US data centers now hold approximately 75% of all GPU cluster compute performance worldwide, with China at ~15% and the remaining ~10% distributed across the EU, Japan, Canada, the UK, and the Gulf states (Epoch AI). The country’s 10× AI infrastructure advantage over China is assessed by RAND. Capital is flowing in at an unprecedented rate — and will continue to do so for at least the next five years.

But the risk architecture has not kept pace with the physical construction. The fundamental problem is this: AI data centers are being built and operated as if they are IT infrastructure, when they are in fact industrial energy campuses — facilities that depend on gas turbines, high-voltage substations, SCADA-controlled power distribution, water treatment systems, and miles of fiber connectivity, all of which carry OT attack surfaces that current security standards do not adequately address.

The seven infrastructure pillars that a modern AI data center depends on — power generation, electrical transmission, telecommunications, water, fuel supply, and intra-facility OT systems — are deeply interdependent. A targeted attack on any one of them does not stay contained. It cascades. AWS US-East-1 (May 2026) demonstrated this directly: a cooling system failure in one availability zone in Northern Virginia triggered a thermal cascade that shut down EC2 and EBS across 20+ dependent services. Google Cloud London (July 2022): simultaneous cooling failure → full facility shutdown. Azure Australia East (VVTQ-J98[38], August 2023): utility power sag → chiller trip → hardware physically damaged. These are documented cascade paths inside data centers — not analogies.

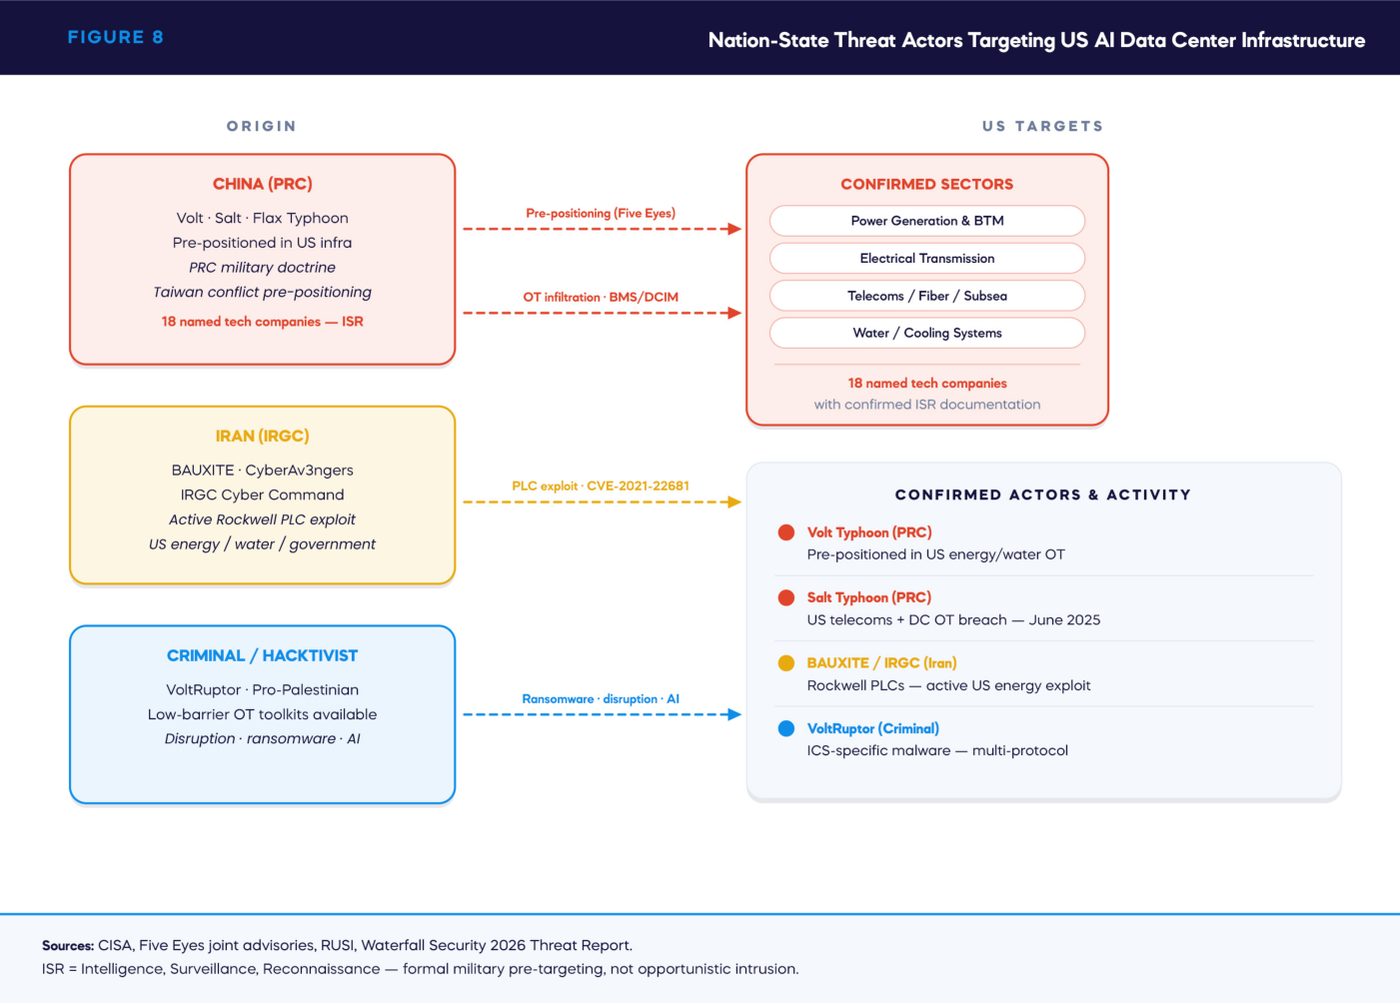
Nation-state actors — specifically PRC-affiliated groups Volt Typhoon, Salt Typhoon, and Flax Typhoon (Figure 8) — have been confirmed as pre-positioned inside US critical infrastructure, including energy systems directly adjacent to the data center power chain. Eighteen named US technology companies, including major hyperscalers, have been documented as targets with confirmed ISR (Intelligence, Surveillance, Reconnaissance) activity. This is not espionage. This is pre-positioning for disruption.

The financial implications are significant and largely unmodeled. Free cash flow at the largest hyperscalers has collapsed under the weight of CapEx — Alphabet projected at negative 90% YoY, Amazon at negative FCF in 2026, Microsoft down 28%. These organizations are issuing investment-grade bonds at scale ($100B+ in 2025–2026) to sustain construction. The balance sheet stress is real, the covenant exposure is real, and an uninsured or unquantified OT loss event in this environment would land on already-stretched financials.

The insurance market is responding — four dedicated programs launched or significantly expanded between June 2025 and April 2026, with Aon DCLP alone expanding three times in nine months to reach $3.5 billion (Figure 16) in capacity. S&P projects $10 billion[8] in new data center insurance premiums in 2026, against a global cyber market of $15.3 billion growing to $28–30 billion by 2030. Yet nearly 9 out of 10 C-level executives report their organization is inadequately protected, according to Munich Re's 2026 Cyber Risk Survey. The programs that exist address the IT and property layers. None has resolved the OT layer. BTM power generation OT — the highest-consequence attack surface in the ecosystem — has no policy form, no actuarial data, and no placement path. Swiss Re has flagged $10 billion single-site loss scenarios as credible concentration risk. The market is growing faster than coverage quality is improving.[7]

A third major broker has now confirmed the structural gap. In May 2026, Gallagher (top-5 global broker) published a client-facing risk advisory identifying OT as Risk #4 and Insurance Capacity as Risk #5.[70] On the OT risk, Gallagher's advisory states that IT/OT convergence in data centers can have "direct physical consequences — disrupting energy management or cooling infrastructure, resulting in equipment damage, downtime, or large-scale service interruptions." On capacity, the advisory notes that hyperscale campuses can exceed individual insurer deployment limits and that facilities demonstrating "disciplined operational controls are better positioned to attract insurance capacity on favorable terms." Both parametric insurance and cyber liability/OT coverage are named as emerging solutions. The signal is explicit: a top-5 global broker is telling its own clients that OT risk is unmanaged — and that operators who quantify it get better terms.

A fourth top-5 broker has joined them. Lockton Global, in its 2025–2026 energy cyber risk advisory, states that ransomware is now "disrupting OT environments, shutting critical systems, and creating contractual and regulatory consequences" — and names OT risk quantification as a prerequisite for meaningful insurance placement. With Aon, Marsh, Gallagher, and Lockton all on record, four of the five largest global insurance brokers now publicly identify OT quantification as the missing enabler for data center and energy infrastructure coverage.[71]

The central recommendation of this analysis: any institution deploying capital into, underwriting debt for, or providing insurance coverage to AI data center infrastructure must be able to answer three questions with evidence: What is the OT-driven loss exposure, expected and tail? What mitigations reduce it, and by how much? What is credibly transferable, and what remains retained? Today, very few can answer any of these.

The outage cost is now quantified. Parametrix, an analytics firm specialising in digital infrastructure risk, calculated that a 45-minute data center outage generates $24 million in service credits[9] and can wipe 40%+ of annual cash flow at the affected facility. DC insurance premiums now total $10 billion in 2026 — double the entire global aviation insurance market. The critical gap: standard property business interruption requires a physical damage trigger. An OT compromise that disrupts cooling or power without causing visible physical damage — the most common attack scenario — falls through: no physical damage, no property BI payout, no coverage. Parametrix quantifies the outcome; DeNexus quantifies the cause. Both are needed; neither alone is sufficient.

The capacity gap has been formally measured. The Eudaimon Report (2026) found that AI data center insurance demand reaches $20 billion per single risk, while the market can supply approximately $2.7–3.5 billion — a 17.5% fill rate, leaving an 82–94% protection gap. CrowdStrike's July 2024 outage demonstrated that even when coverage exists, 72–94% of losses go unrecovered. Eudaimon's first recommendation: "Build the Models First" — without OT accumulation models, there is no basis for deploying additional capacity.[10] The gap is not a capital problem. Reinsurance capital exists. The binding constraint is the absence of quantification infrastructure that allows underwriters to price, structure, and aggregate OT risk at the scale these facilities require.

The central recommendation of this analysis: any institution deploying capital into, underwriting debt for, or providing insurance coverage to AI data center infrastructure must be able to answer three questions with evidence: What is the OT-driven loss exposure, expected and tail? What mitigations reduce it, and by how much? What is credibly transferable, and what remains retained? Today, very few can answer any of these.

The central recommendation of this analysis: any institution deploying capital into, underwriting debt for, or providing insurance coverage to AI data center infrastructure must be able to answer three questions with evidence: What is the OT-driven loss exposure, expected and tail? What mitigations reduce it, and by how much? What is credibly transferable, and what remains retained? Today, very few can answer any of these.

SECTION 01

The Buildout — Scale, Speed, and Strategic Stakes

THROUGH YOUR LENS · DATA CENTER OPERATOR

Speed-to-power decisions — tent structures, BTM turbines, compressed commissioning — are being made upstream of your operations team. This section documents how the pace of the buildout shapes the OT risk profile you inherit on day one.

THROUGH YOUR LENS · PE INFRA INVESTOR

Goldman projects $7.6T in cumulative AI infrastructure investment 2026–2031. This section maps who is building — hyperscalers, REITs, and infrastructure funds acquiring operational assets "with OT systems they have rarely modeled in their diligence."

THROUGH YOUR LENS · LENDER

Q1 2026 actuals annualize above $600B for the Big 3 alone. The section’s credit-relevant thread: ownership structures (self-build, REIT lease, BTM-heavy) carry materially different risk concentration behind the same asset label.

THROUGH YOUR LENS · INSURER / REINSURER

Tent structures in a tornado and hail zone mean different total insured value profiles and different expected maximum loss calculations — the section spells out how construction shortcuts translate directly into underwriting variables.

The Buildout — Scale, Speed, and Strategic Stakes

Capital at a Historic Scale

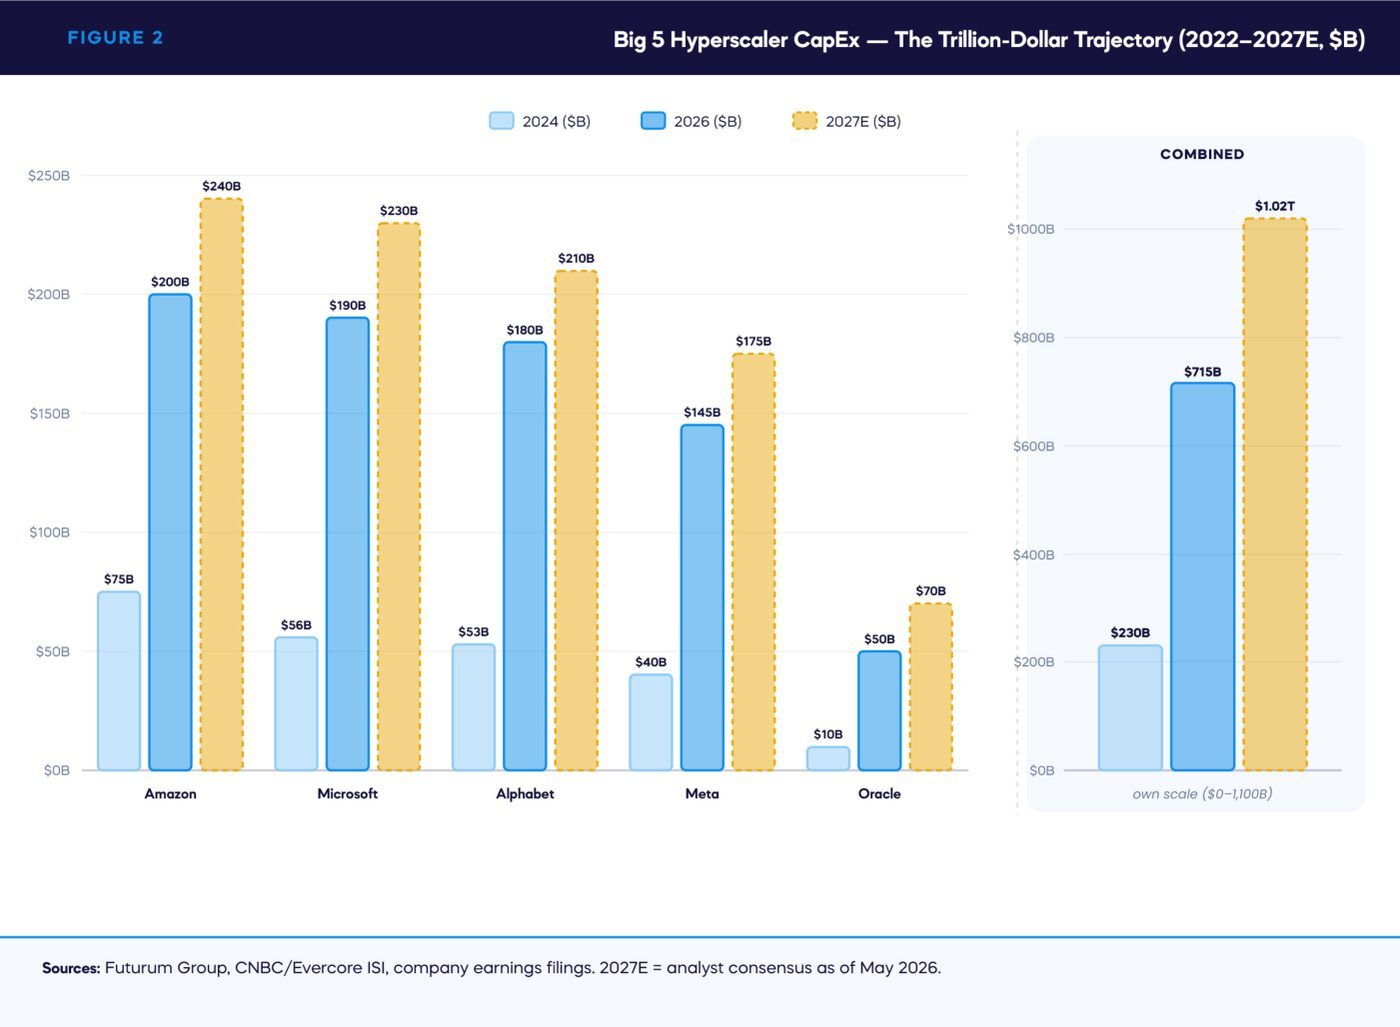
The five largest US cloud and AI providers — Amazon, Microsoft, Alphabet, Meta, and Oracle — committed $660[11] –725 billion in capital expenditure for 2026 alone — a trajectory confirmed by Q1 2026 actuals: Alphabet $35.67B, Microsoft $30.88B (+84% YoY), Amazon $44.20B, annualizing above $600B for the Big 3 alone. That is nearly double their combined 2025 levels, and more than twice what they spent across the entire 2022–2024 period. Analyst consensus now projects combined Big Tech[95] CapEx exceeding $1 trillion in 2027 — the first time in history.[12]

Goldman Sachs projects $7.6 trillion in cumulative global AI infrastructure investment between 2026 and 2031. IoT Analytics puts the global data center infrastructure market on course to surpass $1 trillion in annual spending by 2030.[13] Morgan Stanley describes the AI infrastructure cycle as a multi-year investment commitment with no near-term ceiling.[12]

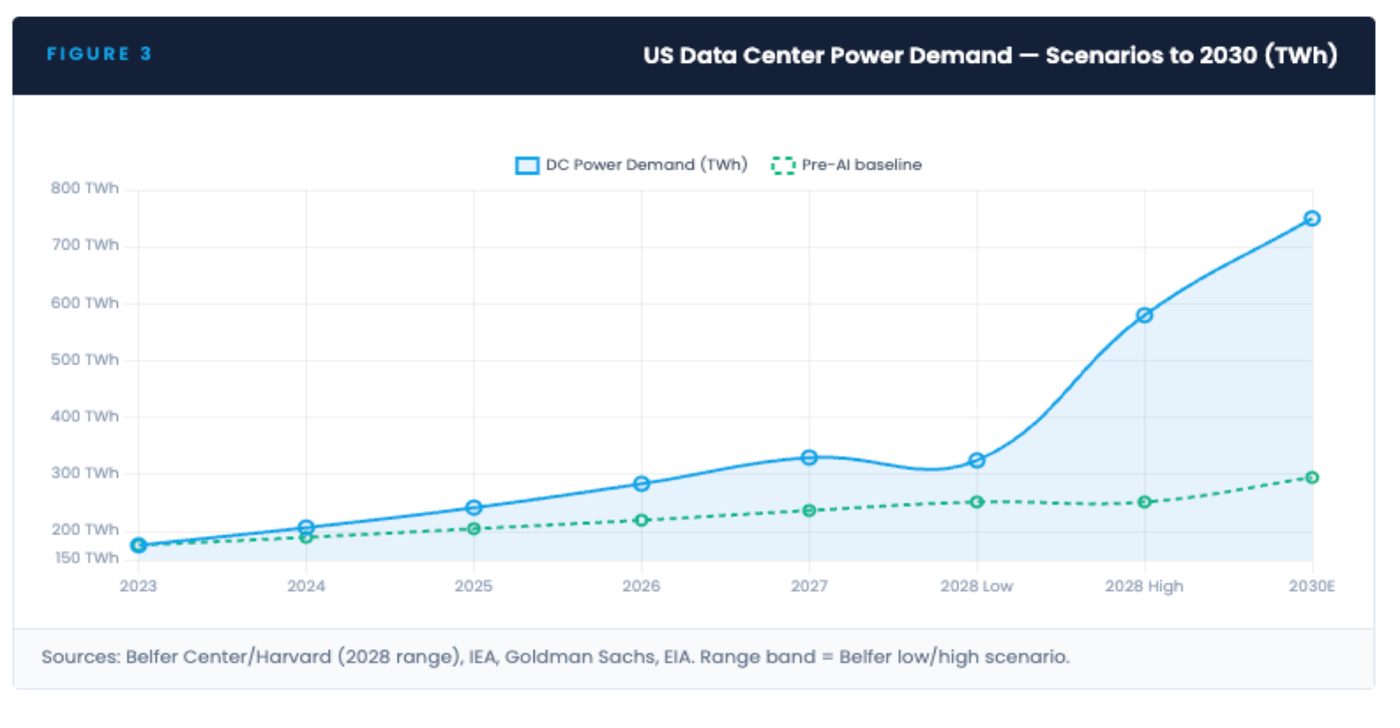
To put the power dimension in perspective: US data center electricity demand stood at 176 TWh in 2023 (Figure 3) [14]. The Belfer Center at Harvard projects it will reach 325–580 TWh by 2028 (Figure 3) — representing 6.7–12% of all US electricity consumption.[15] The IEA confirmed data center electricity demand grew 17% in 2025 alone, well ahead of global demand growth of 3%.[14] Goldman projects global data center power demand up 50% by 2027 and 165% by 2030.
$1T+
Projected Big Tech CapEx in 2027 — first time in history, per Evercore ISI and Bank of America
325-580
TWh US data center electricity demand projected by 2028 (Belfer Center/Harvard) — up from 176 TWh in 2023
75%
Of global GPU cluster compute performance held by the United States — a strategic national asset (Epoch AI)
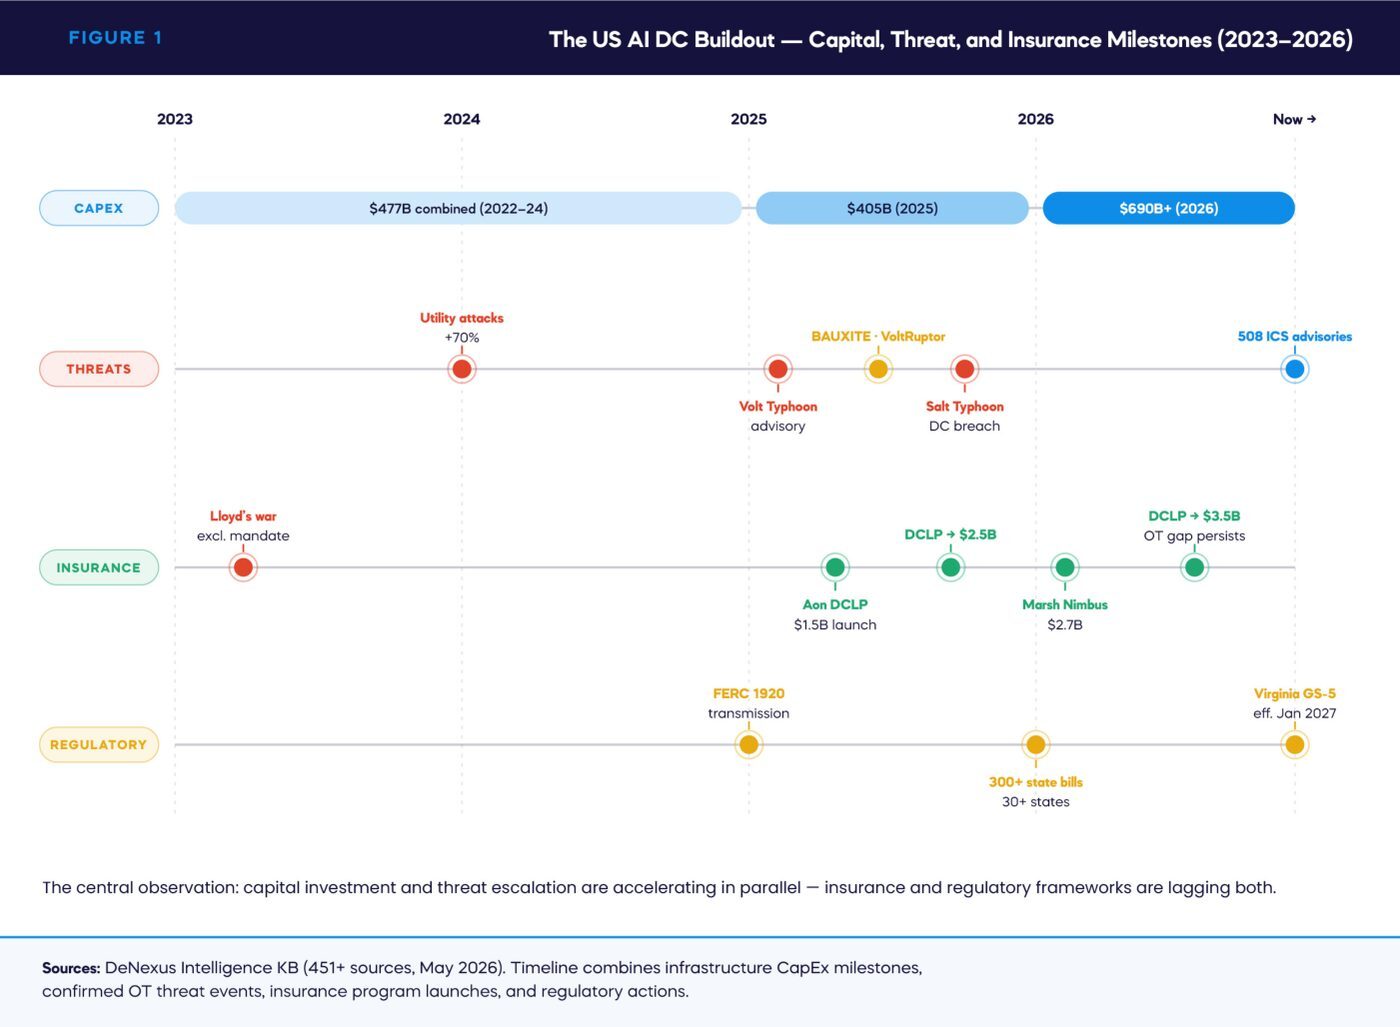
FIGURE 1 — The US AI DC Buildout — Capital, Threat, and Insurance Milestones (2023–2026)
FIGURE 2 — Big 5 Hyperscaler CapEx — The Trillion-Dollar Trajectory (2022–2027E, $B)
FIGURE 3 — US Data Center Power Demand — Scenarios to 2030 (TWh)

The US Strategic Dimension

The AI data center buildout is not just a private sector investment cycle. It is US national infrastructure. The United States holds approximately 75% of all GPU cluster compute performance worldwide (Epoch AI, May 2025), with China in second place at approximately 15% — a 10× compute advantage assessed by RAND Corporation. The remaining ~10% is distributed across the European Union, Japan, Canada, the United Kingdom, and the Gulf states. Traditional high-performance computing leaders — Germany, Japan, and France — now play marginal roles in the AI cluster landscape, as the dominance of US-based hyperscalers has fundamentally reshaped global compute geography. That advantage is the direct product of physical data center infrastructure and semiconductor supply chain investment.

The pace is unprecedented. OpenAI's Stargate program reached 5 GW of operational AI compute infrastructure by early 2026 — already halfway to its 10 GW US target for 2029. Three gigawatts were added in the last 90 days alone, the fastest infrastructure deployment in technology history. Every gigawatt commissioned adds BMS controllers, DCIM endpoints, cooling PLCs, UPS management systems, and BTM generation OT — all at a pace that outstrips the OT security industry's ability to integrate.[19]

The physical constraint is now binding. Engineering News-Record reported that newly added US data center pipeline capacity dropped 50% in Q4 2025 versus Q3 — the single largest quarterly decline on record. Under-construction capacity fell 6% year over year, the first decline since 2020. The bottleneck is not capital — the Big 5 have $602 billion committed for 2026 — it is megawatts. Dominion Energy's interconnection queue in Northern Virginia now runs seven years. A developer breaking ground in Loudoun County today has no grid connection agreement. The result is predictable and accelerating: operators are turning to behind-the-meter generation (gas turbines, battery storage, fuel cells) to bypass interconnection queues. Every megawatt moved BTM adds unprotected OT infrastructure outside NERC CIP scope — precisely the regulatory gap documented in Section 08.[54][20][20]

The construction shortcuts are now visible from satellite imagery. Meta's Prometheus campus in Ohio — targeting 1 GW of AI compute — is building 7 of its 12 data center structures as weatherproof tents[22]: temporary modular buildings deployed for speed-to-power rather than permanence. Tent structures have fundamentally different OT risk profiles: less robust environmental controls, different cooling architectures, higher physical vulnerability to weather events. Ohio sits in a significant tornado and hail zone (Swiss Re sigma, July 2026). The insurance implications are direct: different total insured value profiles, different expected maximum loss calculations, and different OT cooling systems than a permanent concrete facility. When the buildout moves faster than permanent construction can deliver, the OT attack surface takes whatever form gets to megawatts fastest.[23]

RAND warns explicitly that if the US cannot find adequate power to sustain the buildout, data centers — and the AI compute advantage with them — may migrate abroad. The export control regime that limits China's access to advanced AI chips depends on US data centers remaining the world's primary AI compute platform. This is why the buildout is receiving regulatory acceleration at the federal level that would be impossible for purely commercial investments.

Who Is Building — and What That Means for Risk
The data center ownership and operator landscape has material implications for risk concentration. Hyperscalers — Amazon (AWS), Microsoft (Azure), Google (Google Cloud), Meta, and Oracle — own and operate the largest share of AI-capable facilities. They are joined by colocation Real Estate Investment Trusts (REITs) — Equinix, Digital Realty, Iron Mountain, QTS — that lease capacity to hyperscalers and enterprise clients. Increasingly, sovereign wealth funds, infrastructure private equity, and dedicated AI infrastructure vehicles are entering the market.

Each ownership structure carries different risk profiles. Hyperscalers are vertically integrated and increasingly deploying behind-the-meter (BTM) generation at scale — meaning they own and operate the gas turbines, battery systems, and power distribution infrastructure on-site. This substantially increases their OT attack surface compared to a traditional grid-connected colocation facility. REITs own the physical assets but lease to operators, creating split liability structures that complicate insurance placement and incident response. Infrastructure funds are acquiring operational assets with OT systems they have rarely modeled in their diligence.

The speed problem. Grid interconnection timelines in the primary US data center markets run 4–7 years (Figure 5). Construction timelines for a major hyperscale campus run 18–36 months. The gap between what can be built and what the grid can deliver is being filled by BTM generation — on-site gas turbines (Figure 5), diesel generators, and battery systems — deployed at a pace the OT security industry has not kept up with.

The Energy Park Model — May 2026

Google's $4.75 billion acquisition of Intersect Power (May 28, 2026) reveals the next evolution: gigawatt-scale "Energy Parks" that operate primarily behind-the-meter, with the public grid demoted to a secondary reliability layer. Each Energy Park converges solar arrays, massive battery energy storage systems (2 GWh+), HVDC distribution, liquid cooling, BMS, and DCIM into a single high-density campus at 10–20× the power density of traditional data centers.[24] None of these facilities fall under NERC CIP obligations. When a Google Energy Park islands from the grid, no regulator mandates OT security and no standard insurance product covers it. The model will replicate across every major hyperscaler — each deployment adds unregulated gigawatt-scale OT attack surface.
The nuclear dimension is accelerating in parallel. Brookfield Asset Management is paying $2.7 billion to restart the abandoned VC Summer nuclear site in South Carolina — specifically to sell power to AI data centers.[25] The US Department of Energy is advancing loan guarantees to 5–6 utilities for AP1000 reactor long-lead components, while the Department of Commerce is pursuing a separate program covering another 10 AP1000 units — potentially 20 new large US reactors. Nuclear OT environments (instrumentation and control, safety systems, turbine controls) carry the highest consequence profile of any OT class in the US, and none are currently priced for nation-state cyber risk.

SECTION 02

The Industrial Reality Behind the Digital Promise

THROUGH YOUR LENS · DATA CENTER OPERATOR

Seven pillars, tightly coupled, each with its own OT backbone — and the cascade is documented operating history, not theory: AWS US-East-1’s May 2026 cooling failure impaired EC2, EBS and 20+ services. This is the map of your facility’s failure modes.

THROUGH YOUR LENS · PE INFRA INVESTOR

An AI data center is an industrial energy asset, not an IT asset. The seven-pillar interdependency map is the diligence checklist: each pillar an infrastructure fund acquires carries an OT risk profile conventional models "systematically underestimate."

THROUGH YOUR LENS · LENDER

Grid interconnection runs 4–7 years against 18–36 month construction timelines — the gap is filled by BTM generation the borrower owns and operates. That changes what is actually securing the loan.

THROUGH YOUR LENS · INSURER / REINSURER

The cascade scenarios documented here — HVAC failure → thermal rise → server shutdown → extended BI loss — are precisely the correlated, multi-system events that individual-asset risk models and current policy forms do not capture.

The Industrial Reality Behind the Digital Promise

These Are Not Server Buildings

The dominant narrative frames AI data centers as a technology story. The physical reality is an industrial story. A modern hyperscale AI campus drawing 300–500 megawatts is, in engineering terms, comparable to a mid-sized industrial manufacturing complex or a regional power generation facility. It runs continuously. It requires uninterrupted fuel supply. It depends on cooling water. It operates high-voltage electrical infrastructure. And it is controlled by industrial operational technology — the same class of systems that runs oil refineries, chemical plants, and power stations.

Our DeNexus OT experts have experience in these kinds of environments. The control rooms look different. The server racks are different. But the operational DNA — the dependency on OT systems for physical continuity, the vulnerability of those systems to adversarial interference, the catastrophic consequences of an unplanned shutdown — is the same.

The Seven Infrastructure Pillars

A functioning AI data center depends on seven infrastructure pillars operating simultaneously (Figure 4) and reliably. Each one has its own OT backbone. Each one has its own cyber risk profile. And each one is connected to the others in ways that create cascading failure paths that standard risk models do not capture.

TABLE 1 — The Seven Infrastructure Pillars — OT Backbone and Interdependency Map
PillarPrimary OT SystemsKey DependencyCascade Failure PathOT Risk Level
Power Generation (BTM)Gas turbine DCS, generator governor controls, automatic transfer switches, battery management systemsOn-site gas supply continuity; turbine availabilityGenerator trip → power loss → thermal runaway in GPU racks → hardware damage → BI lossCRITICAL
Electrical TransmissionSubstation SCADA, protection relays, transformer monitoring, switchgear automationGrid stability; PJM/ERCOT dispatch reliabilitySubstation compromise → voltage event → UPS bypass → facility-wide outageCRITICAL
Telecommunications/FiberNetwork Operations Center (NOC) systems, subsea cable landing systems, dark fiber OMSFiber route diversity; subsea cable integrityFiber cut or NOC compromise → connectivity loss → revenue outage → contract defaultHIGH
HVAC / Thermal ManagementCRAC/CRAH unit controllers, hot/cold aisle containment OT, precision air conditioning BMS, airflow management PLCs, temperature and humidity sensorsAirflow integrity; air pressure management; ambient temperature and humidity control; heat rejection capacityHVAC failure → thermal runaway → server auto-shutdown → BI loss. Confirmed cascade: AWS US-East-1 (May 2026), Google Cloud London (July 2022), Azure VVTQ-J98 (August 2023)CRITICAL
Water Systems
Support to HVAC
Chilled water loop SCADA, cooling tower PLC, water treatment automation (chemical dosing, pH and algae control, filtration), chiller plant BMS, pump and valve controllers, humidification system controllersChilled water supply to HVAC cooling loops; heat rejection via towers; humidity control; chemical water treatmentChiller failure → loss of chilled water to HVAC → thermal cascade. Azure VVTQ-J98: utility power sag → chiller plant tripped → two data halls lost cooling → hardware physically damagedHIGH
Fuel / Natural Gas SupplyPipeline SCADA (upstream), compressor station controls, on-site storage meteringGas pipeline integrity; BTM turbine fuel availabilityPipeline disruption or BTM fuel starvation → generator trip → see Power Generation pathHIGH
Intra-Facility OT (BMS/DCIM)Building Management System (BMS), Data Center Infrastructure Management (DCIM), UPS management, Electronic Power Management System (EPMS), fire suppression controls, access controlIT/OT convergence integrity; vendor remote accessBMS compromise → HVAC/cooling manipulation → thermal event OR fire suppression discharge → facility damage. EPMS compromise → forced load shedding or incorrect load balancing → unplanned GPU rack shutdown → BI lossCRITICAL

Sources: Waterfall Security, Tenable, Claroty, Asimily, IoT Analytics, IEA, Belfer Center/Harvard. DeNexus analysis.[3][26]
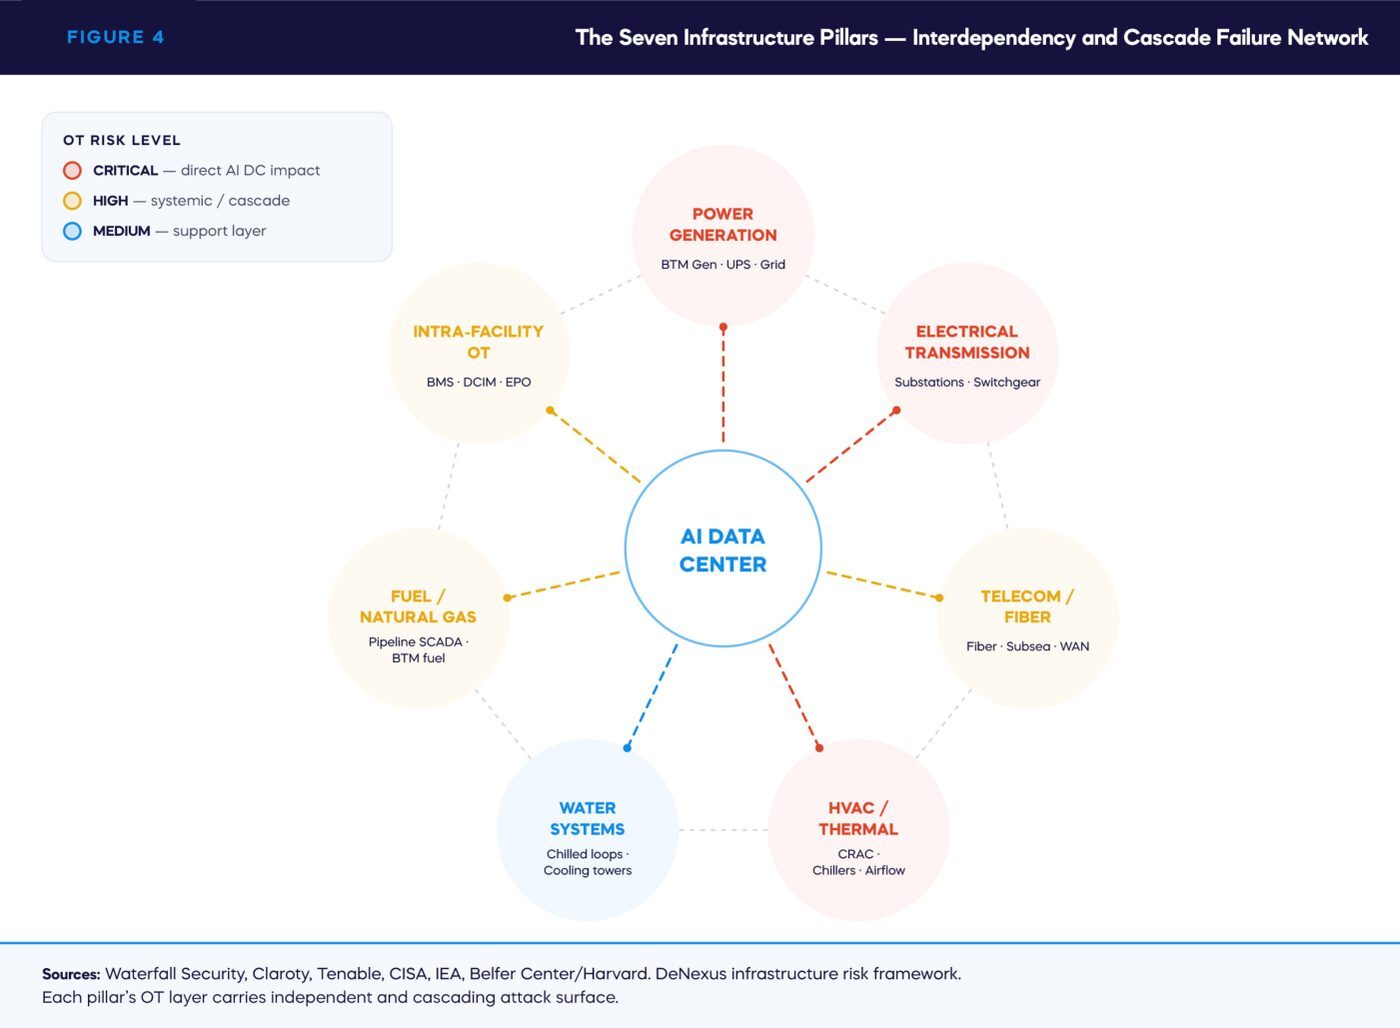
FIGURE 4 — The Seven Infrastructure Pillars — Interdependency and Cascade Failure Network

The Interdependency Problem

The seven pillars do not operate independently. They are tightly coupled. Power generation depends on fuel supply. Cooling depends on water availability and on power. Telecommunications depends on power. Intra-facility OT systems depend on all of the above and provide the control layer that orchestrates them. If data hall temperature cannot be maintained, the operator is forced to constrain or shed user load in order to keep the heat generation to a safe level.

This coupling creates cascade failure scenarios that conventional risk models — designed for individual asset risk — systematically underestimate. The model is not hypothetical — it has been empirically demonstrated inside data centers themselves. On May 7–8, 2026, AWS US-East-1 (Northern Virginia — the single most concentrated AI cloud region on earth) experienced a cooling system failure in availability zone use1-az4. Temperatures rose until servers automatically shut down to protect hardware. EC2, EBS, and more than 20 dependent AWS services were impaired. Recovery of cooling capacity took longer than anticipated. The cascade path: HVAC cooling failure → thermal rise → server auto-shutdown → extended BI loss across global-dependent services. Google Cloud's London region experienced a structurally identical failure in July 2022 when "simultaneous failure of multiple, redundant cooling systems" during the UK heatwave forced a full facility shutdown to prevent hardware damage. Azure Australia East (VVTQ-J98, August 2023) followed the same pattern: a utility power sag tripped the chiller plant offline for two data halls, physically cooking hardware before the thermal event was controlled. These are not edge cases. They are the documented operating history of the infrastructure this analysis is about.

A six-campus comparative analysis published in July 2026 (Measured AI) confirms that the interdependency problem is compounded by radical structural variation. The study documents four distinct ownership models now operating simultaneously in the US AI DC market — each producing a fundamentally different OT risk topology:[30]

Type 1

Vertically Integrated Self-Build

AWS New Carlisle ($11B, 2.25 GW, 500K Trainium2), Google Ohio ($20B+). Owner controls all OT from silicon to substation. Highest OT maturity potential, but concentration risk: one OT event disables entire committed compute.[31]

Type 2

Campus REIT Lease

Microsoft Monarch, WV (1.35 GW, non-binding LOI). Microsoft won't own the campus. OT ownership ambiguity: who is responsible for OT cyber risk — the owner, lessor, or operator? WV HB2014 exempts BTM from utility oversight.[34]

Type 3

Grid-Only, No Redundancy

Microsoft Fairwater, Atlanta. Zero backup generators, zero UPS, zero BTM. "4×9 availability at 3×9 cost." Eliminates Pillar 1 OT but creates 100% grid dependency — grid OT compromise means immediate total outage.[32]

Type 4

Fully Off-Grid / Islanded Microgrid

xAI Colossus, TN/MS (~770K GPUs). Two of three buildings fully off-grid. DOJ intervened in Clean Air Act suit on national-security grounds. OT attack on generators destroys $1.25B/month in committed AI compute.[33]

No standard playbook exists. Different ownership structures produce different OT risk topologies, different cascade paths, different insurance exposure profiles, and different regulatory obligations. A single OT risk framework cannot cover all four models. The only defensible approach is bespoke cyber risk quantification calibrated to the specific campus architecture — exactly the capability gap this analysis documents.

What makes the AI data center situation materially more dangerous than prior generations is the heat load. GPU-dense AI racks generate substantially more thermal load per rack than CPU-era infrastructure. Traditional air cooling designs are insufficient for AI compute density, which is why liquid cooling and advanced thermal management are growing rapidly. Higher heat loads mean shorter time-to-damage when HVAC fails, less margin for recovery, and faster cascade escalation. The HVAC system is no longer a utility concern — it is a tier-one OT risk surface for AI data center infrastructure.

What makes the situation more acute today is the rapid deployment of BTM generation — on-site gas turbines and diesel generators installed because the grid cannot keep pace with demand. These installations are industrial in character, often operated by organizations with no history of managing gas turbine OT security, and they are being commissioned at a rate that outpaces any reasonable assessment or hardening timeline.
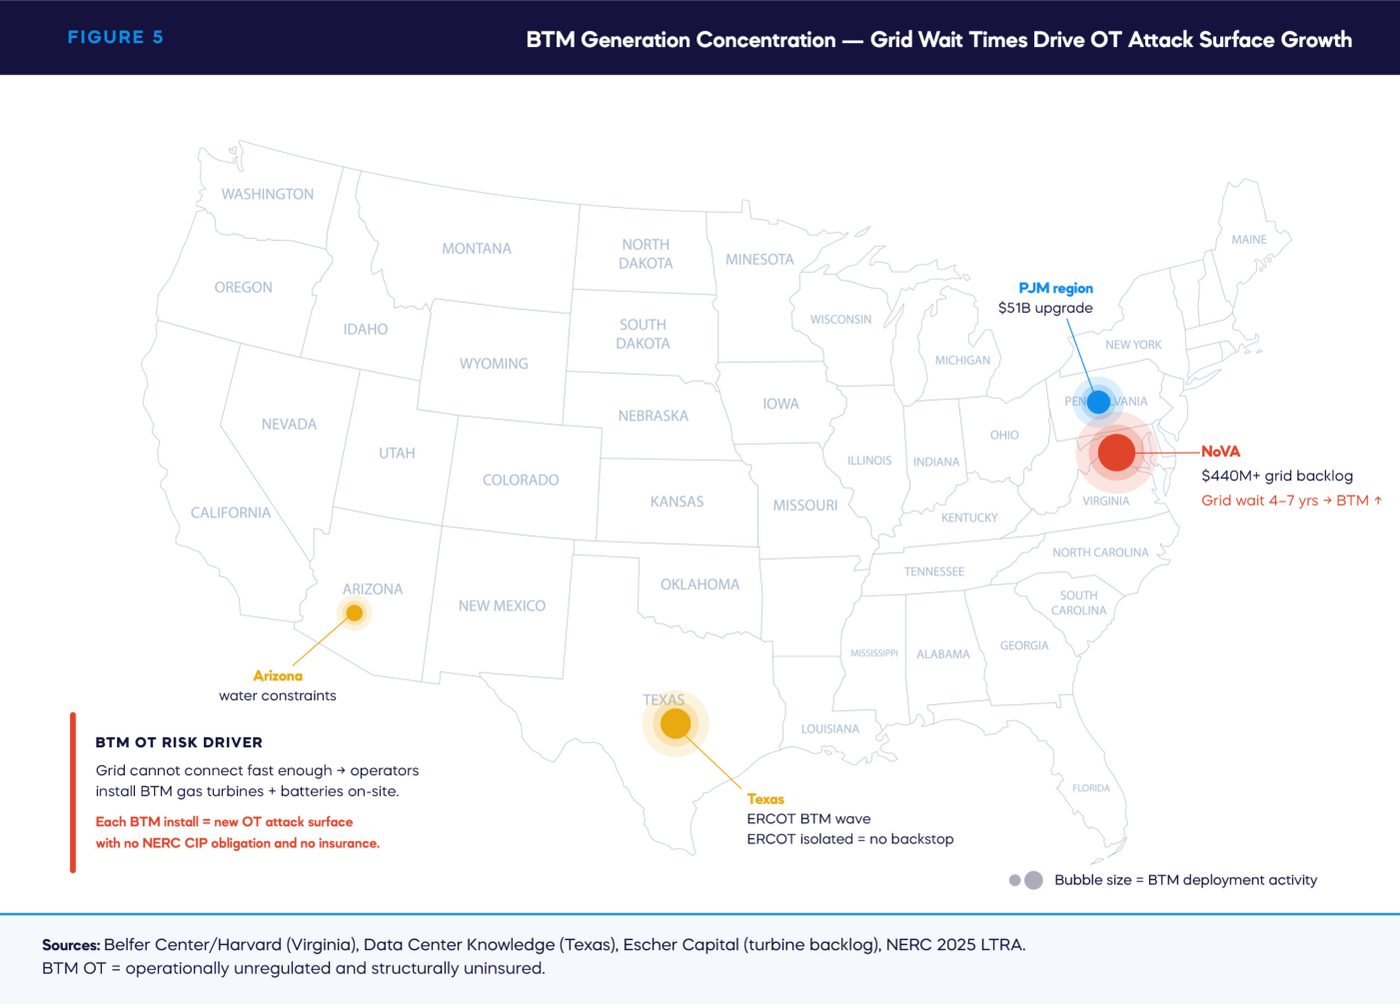
FIGURE 5 — BTM Generation Concentration — Grid Wait Times Drive OT Attack Surface Growth

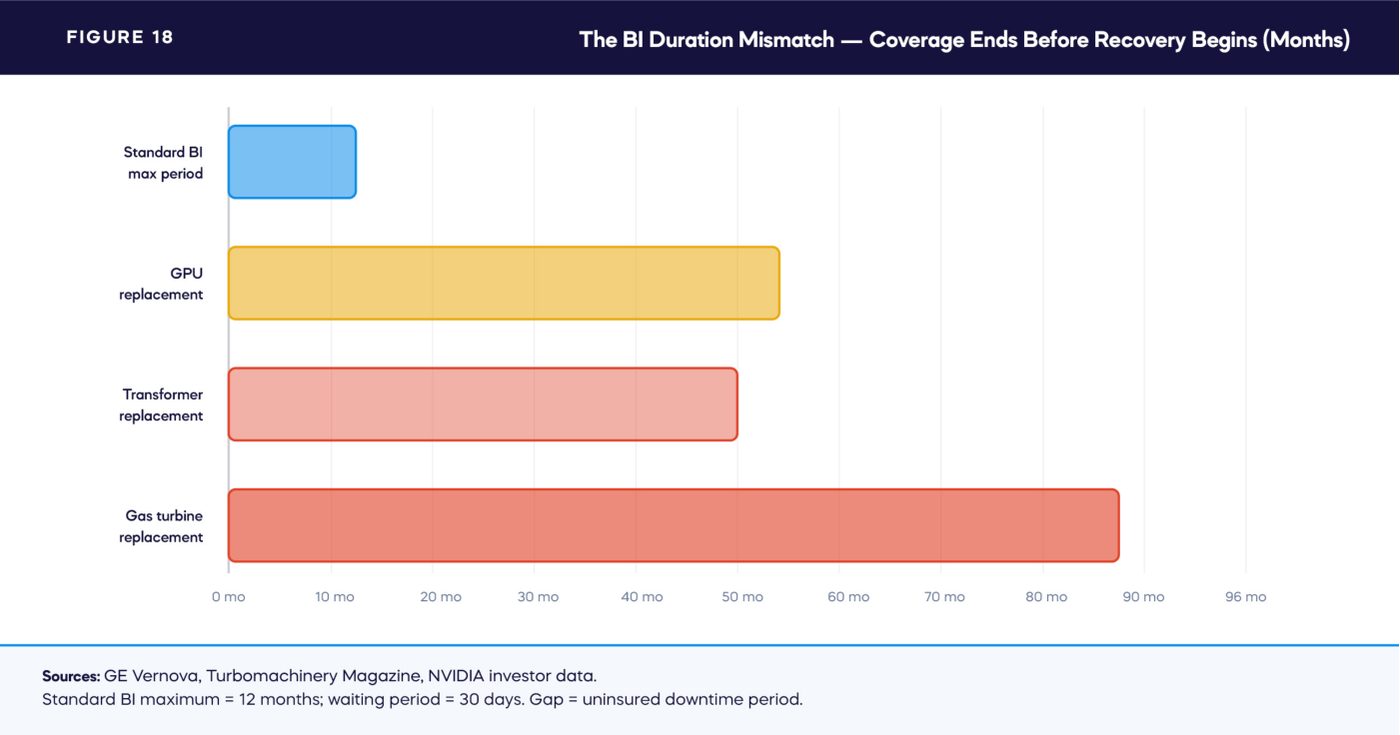
On BTM OT specifically: Mitsubishi Power is sold out through 2028. GE Vernova is explicitly marketing gas turbines in the 50–700 MW range to data center operators.[35] The turbine backlog means some facilities are running older, less efficient units past their recommended service life — with aging OT systems and deferred maintenance adding attack surface faster than it can be managed.

The Industrial Reality

When the Infrastructure Fails: Documented Data Center Outages Caused by OT Equipment

The incidents below are not theoretical. They are post-incident reviews, SEC filings, and engineering reports from operating hyperscale and colocation data centers. In each case, the failure that caused the outage originated in a programmable electronic device or OT control system — not in IT software, not in a network configuration error. These are failures of the HVAC, power, and water systems that every AI data center depends on, and that 75% of the world's computing infrastructure concentrates in Northern Virginia alone.

Virginia Grid Cascade — 2026

In early 2026, nine data centers in Northern Virginia simultaneously went offline or switched to backup power during a grid restoration event. The mismatch produced an over-frequency event that nearly triggered rolling blackouts affecting households on medical devices. DOE's Jigar Shah publicly called for federal oversight of gigawatt-scale grid integration. The critical finding for this analysis: nine data centers dropping offline simultaneously is also the exact signature of a coordinated OT cyberattack — and the grid cannot distinguish between a mechanical failure and a deliberate cyber event. Regulators couldn't either. This incident also reveals curtailment and load-shifting software as a new OT attack vector: threat actors could mimic a curtailment signal or block one at a critical moment. NERC's own 2026 State of Reliability report, published June 25, 2026, now documents these events with authoritative MW figures. In 2025 alone, data center customer-initiated load reduction (CILR) events in the Eastern Interconnection reached 1,800 MW (February), 1,300 MW  (June), and 540 MW (May) [35] — each a single-incident grid disturbance caused by computational loads disconnecting in seconds. ERCOT logged nine additional cryptocurrency and computational load CILR events exceeding 100 MW. These are the incidents that triggered NERC's Level 3 Alert and the creation of the Computational Load Entity registration category. The scale is no longer hypothetical: data centers are now producing grid disturbances at megawatt volumes that were previously associated only with generation trips or severe weather events.

This section is the factual foundation for the risk argument made throughout this analysis. Data center operators, lenders, and insurers should read it as an operating history, not as a collection of edge cases.

Editorial note: The events in Table 5 represent OT cyber incidents in the broader AI infrastructure ecosystem. For documented outages caused by OT equipment failures specifically inside data centers, see Table 2 on the following page.

TABLE 2 — Documented Data Center Outages — OT/Programmable Device Root Cause (2022–2026)
DateFacility / OperatorPillarOT Device / Gray-Space SystemCascade Path & ImpactSource
May 7–8, 2026AWS US-East-1
Northern Virginia (use1-az4)
HVAC / ThermalChiller / cooling system controllers. Backup cooling also failed to maintain capacity. BMS-managed temperature thresholds triggered automatic shutdown logic.Cooling failure → thermal rise → server auto-shutdown to protect hardware → EC2 and EBS impaired across availability zone. 20+ dependent AWS services disrupted. Recovery "slower than originally anticipated." Northern Virginia carries global IAM, CloudFront, Route 53 dependencies.AWS Health Dashboard; The Register; Network World; DCD (May 2026)
Nov 5, 2025Microsoft Azure
West Europe region
HVAC / ThermalDatacenter thermal management OT. Automated cooling protection systems activated and took storage scale units offline. BMS thermal protection logic.Thermal event → automated cooling protection → storage scale units offline → degraded performance across multiple availability zones. Azure Storage, dependent compute services impaired.The Register; Windows Forum (November 2025)
Aug 30, 2023Microsoft Azure
Australia East (VVTQ-J98)
Power + HVACChiller plant PLC/BMS. Utility power sag caused chiller plant to trip offline for two data halls. Insufficient staff on-site to respond. Hardware physically damaged by thermal exposure.Utility power sag → chiller plant tripped → two data halls lost cooling → hardware "cooked." Multiple Azure services impacted. Physical hardware damage required replacement. "Insufficient staff on site" cited in PIR.Azure PIR VVTQ-J98; iTnews Australia; Microsoft (August 2023)
Sep 16, 2023Microsoft Azure
East US (2LZ0-3DG[39])
Power + BMSPower infrastructure OT + BIOS/firmware control systems on host machines. Power event caused BIOS-level failures on a subset of physical hosts.Power event → BIOS failure on physical hosts → VM failures → multiple Azure services impacted in East US. Cascaded to dependent compute and storage workloads.Azure PIR 2LZ0-3DG; YouTube Incident Retrospective (October 2023)
Aug 27, 2022Microsoft Azure
West US 2 (MMXN-RZ028)
PowerDatacenter power distribution OT. Power infrastructure failure affecting facility-level power management systems (UPS, ATS, PDU control systems).Power infrastructure failure → multiple Azure services impacted in West US 2. Compute, storage, and networking services disrupted across the region.Azure PIR MMXN-RZ0; YouTube Incident Retrospective (August 2022)
Jul 19, 2022Google Cloud
London (europe-west2-a)
HVAC / ThermalCooling system PLCs/SCADA. "Simultaneous failure of multiple, redundant cooling systems" during UK heatwave. No single-point failure — entire redundant cooling layer failed under peak thermal load.Multiple redundant cooling systems failed simultaneously → facility could not maintain safe operating temperature → full facility shutdown to prevent hardware damage. Multiple Google Cloud services unavailable. Google: "This is not the level of quality and reliability we strive to offer."DCD; Google Cloud Incident Report (July 2022)
~2022Equinix Singapore[36]
Colocation facility
HVAC / ThermalCooling system failure at colocation facility. Chiller or CRAC unit failure causing thermal event. OT-controlled cooling infrastructure.Cooling failure → facility thermal event → 2.5 million payment transactions failed. Two major banks (DBS and Citibank) lost transaction processing capability. Financial services BI loss from infrastructure OT failure.Uptime Institute Annual Outage Analysis; The Register (April 2024)[36]
Jan 18–19, 2024Applied Digital
Ellendale, North Dakota
PowerPower distribution OT. Complete facility power outage. Power management and distribution systems — UPS, ATS, generator control systems — failed to maintain continuity.Complete power outage → entire facility offline → material revenue impact disclosed. SEC 8-K filing: "The outage is currently expected to last three days while the overall maintenance activities are expected to last up to two weeks." Management cited potential material revenue impact for the quarter.SEC Form 8-K, Applied Digital Corp. (Filed February 2024)
Feb 2026Microsoft Azure
Southeast Asia
Power + HVACPower surge triggered cooling system failure. Power management OT and cooling control systems interacted to produce compounding failure. Both power and HVAC OT layers affected.Power surge → cooling failure → multiple Azure services impacted across Southeast Asia. Compound power/thermal event demonstrating inter-pillar cascade (Power → HVAC → Compute).Data Center Dynamics (February 2026)

What the table above tells investors, lenders, and insurers. Nine of the ten incidents above involved an OT device in the HVAC/cooling or power distribution layer — not a cyberattack, not a software bug. This is the Uptime Institute finding made concrete: power failures cause 45–54% of all impactful outages; cooling failures cause 19%. Together they account for more than two-thirds of all significant data center downtime. [36] The OT systems controlling these layers — chillers, CRAC units, UPS management systems, automatic transfer switches, power distribution units — are programmable electronic devices in the gray space between facility engineering and cyber risk. They are monitored least, secured least, and covered least by existing insurance products. The Equinix Singapore incident is the financial consequence made visible: cooling OT failure → 2.5 million failed transactions → quantifiable financial loss attributable to a single programmable device category. The AWS US-East-1 May 2026 thermal event is the AI-era version of the same failure, at a facility that carries 70% of global internet traffic through its region. [66]

The geographic dispersion is now accelerating by regulatory force. As of July 14, 2026, New York became the first US state to impose a statewide data center moratorium — a one-year halt on state environmental permits for hyperscale facilities with peak demand of 50 MW or more, via Executive Order No. 62 signed by Governor Hochul. [43] Maine's governor vetoed a similar bill in April. Over 100 local moratoria have been adopted nationwide. An estimated $64 billion in projects have been blocked or delayed by community opposition. The effect on OT risk geography is direct: projects blocked in regulated states (NY, potentially ME, MN, PA) relocate to permissive states — Texas, Tennessee, West Virginia, Ohio — where BTM generation, weaker grid oversight, and zero OT cybersecurity standards are the default. The moratorium does not reduce national OT risk. It concentrates it geographically in the jurisdictions least equipped to manage it.

Swiss Re's sigma report (July 2026) quantifies the exposure: approximately 25% of US data center capacity now faces frequent large hail risk, and 40%+ sits in significant tornado zones. [23] The high-growth states — West Texas, Tennessee, Ohio, Wisconsin — are precisely those with elevated nat-cat profiles. With 64% of 2026 DC construction outside traditional hubs, new facilities are being sited directly into elevated natural catastrophe exposure. Meta's Prometheus campus in Ohio — 7 of 12 buildings are tents — sits in a state where Swiss Re maps significant hail and tornado risk. The convergence of regulatory arbitrage, nat-cat exposure, and unregulated OT in a single geography is the compound risk this section documents.

The physical tail-risk endpoint is the OVHcloud Strasbourg fire (March 2021): a UPS battery management failure triggered thermal runaway, overwhelmed inadequate fire suppression, and completely destroyed the SBG2 data centre — with SBG1 partially damaged and millions of websites taken offline. The UPS management system is network-connected OT: precisely the same layer that cyber adversaries target for physical damage. The incident demonstrates what happens when OT risk materialises at the extreme tail: total facility loss with no customer data recovery.

A related development is making this OT surface interactive with the grid. EPRI's Flex MOSAIC™ program — with live demonstrations involving NVIDIA, Nebius, and National Grid UK — is formalising data center flexibility as a dispatchable grid resource. [84] DC OT systems (SCADA, BMS, UPS, cooling controls, power management) will receive and respond to real-time grid curtailment signals. This grid-interactive OT creates a new attack surface: an adversary who can mimic or block a curtailment command can affect not just the data center but grid stability itself. As data centers become grid participants, OT cyber risk quantification becomes a grid reliability requirement.

The Uptime Institute Data: OT Failure Is the Dominant Cause of Downtime
Uptime Institute's 2026 Annual Outage Analysis confirms the pattern above as systemic rather than anecdotal. Power failures cause 45–54% of all impactful data center outages and have held the number-one position consistently across every year of analysis since the first report. Cooling failures cause 19% of impactful outages — the second-leading cause. Together, OT infrastructure failures in the power and HVAC layers account for more than two-thirds of all significant data center downtime globally. Within power incidents, the specific root causes are: UPS failures, automatic transfer switch (ATS) failures, and generator control failures — all programmable electronic devices. The 2026 report also identifies equipment shortages forcing operators to use substitute or secondhand components (transformers, generators, switchgear, UPS systems) as an emerging risk factor, directly increasing OT control failure probability for the world's most rapidly expanding infrastructure category. [36]

SECTION 03

OT Cyber Risk — The Systemic Blind Spot (Central Thesis)

THROUGH YOUR LENS · DATA CENTER OPERATOR

The central thesis is about your stack: the IT layer gets the security investment, the building OT layer carries the highest-probability attack paths, and the power generation OT layer carries the highest consequences. 75% of BMS have KEVs; monitoring covers fewer than 10% of OT environments.

THROUGH YOUR LENS · PE INFRA INVESTOR

Nation-state actors are confirmed pre-positioned — CISA assessed Digital Realty, operator of hyperscale DC campuses, as a likely target of the Salt Typhoon telecom-espionage campaign (no confirmed OT impact). For a fund, this section defines the tail risk sitting inside every AI infrastructure position.

THROUGH YOUR LENS · LENDER

The Stryker case gives the first hard-dollar P&L anchor: a ~$317M revenue miss from a destructive attack. This section is the evidence base for asking what an OT event does to a borrower’s debt service before you commit.

THROUGH YOUR LENS · INSURER / REINSURER

War exclusions apply to exactly the actors documented here as most active. The taxonomy in this section — nation-state, criminal, hacktivist — maps directly onto which losses your current policy language would and would not respond to.
What OT Is, and Why It's Different

Operational technology (OT) is the hardware and software that monitors and controls physical processes — turbines, cooling systems, fans, power distribution, access control, fire suppression - in the gray space. IT systems process information. OT systems move physical matter and energy. When an IT system is compromised, data is at risk. When an OT system is compromised, physical infrastructure is at risk. The consequences operate on different timescales, with different reversibility, and with potential for physical damage that no backup or restore operation can undo.

The risk community has spent two decades building frameworks for IT cyber risk — penetration testing, vulnerability scanning, patching cycles, endpoint detection. Almost none of those tools translate directly to OT environments. OT systems often run proprietary protocols (Modbus, DNP3, IEC 61850), have operational constraints that make patching impossible without planned downtime, and were designed decades before network connectivity — and certainly before adversarial cyber operations — were a design consideration. The security paradigm, the tooling, the talent, and the insurance products are all calibrated for IT. OT is a different problem.

The AI Data Center OT Attack Surface

The attack surface in an AI data center is best understood as four concentric layers, each with distinct OT exposure. The outermost layer is corporate IT — the standard target for phishing, ransomware, and credential theft. Moving inward: network infrastructure (fiber interconnects, NOC systems, internet service providers). Then building and facility OT — the BMS, DCIM, HVAC controls, power management systems. At the core: the power generation OT — gas turbine distributed control systems (DCS), switchgear automation, transformers, UPS management, power distribution.

The IT layer is where almost all current security investment and insurance coverage is focused. The building OT layer is where the highest-probability attack paths currently run. The power generation OT layer is where the highest-consequence events originate. The three layers are connected — and the connections are the attack vectors.
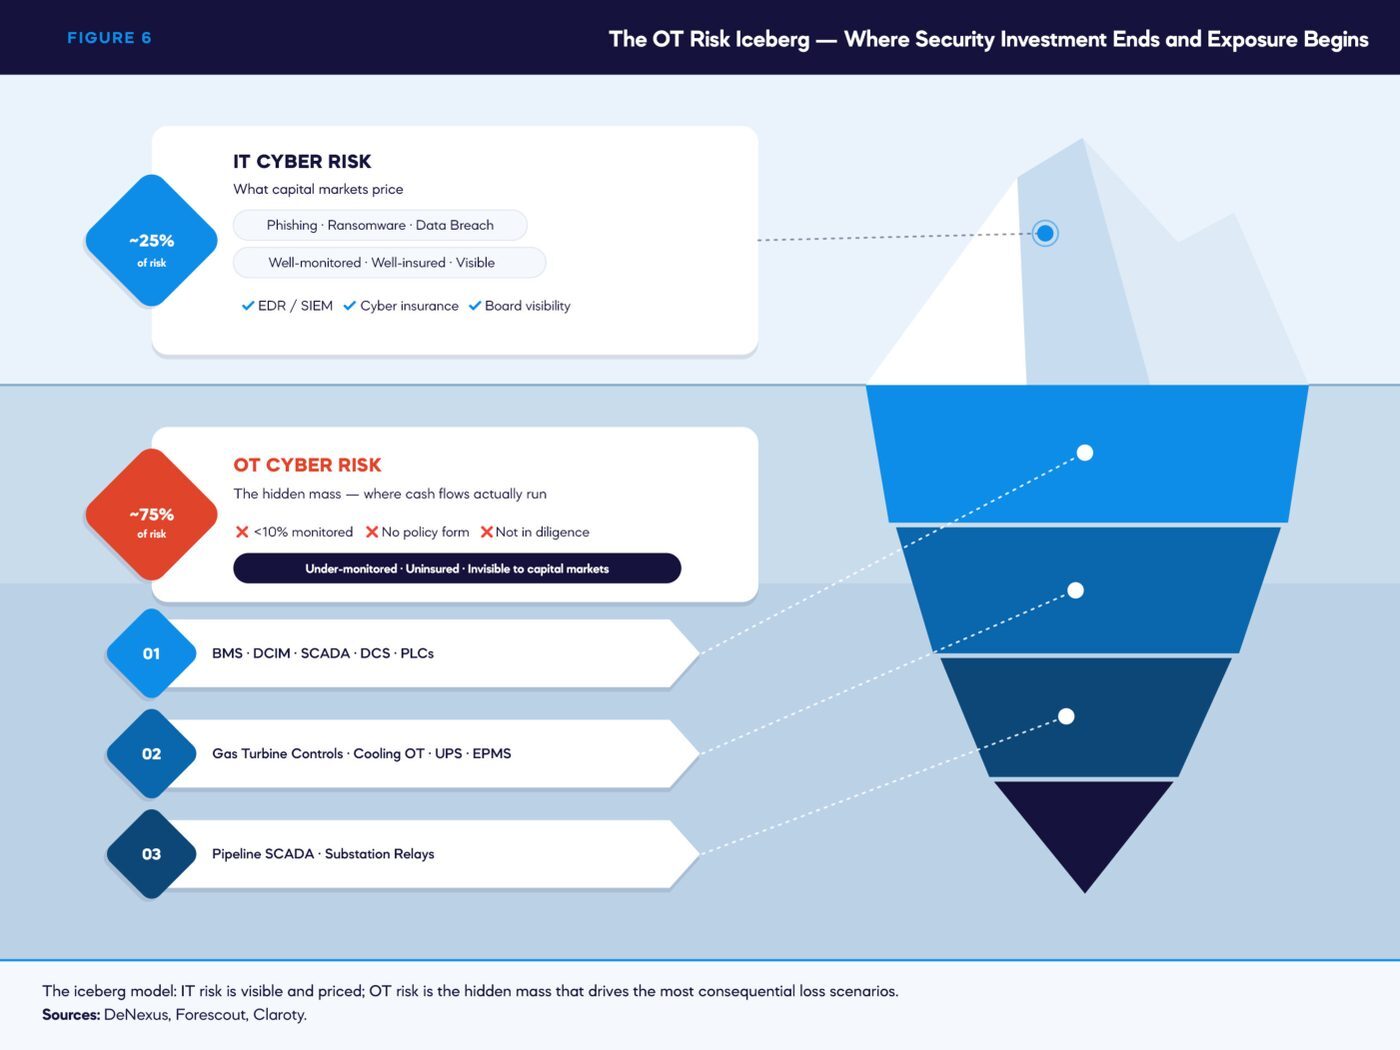
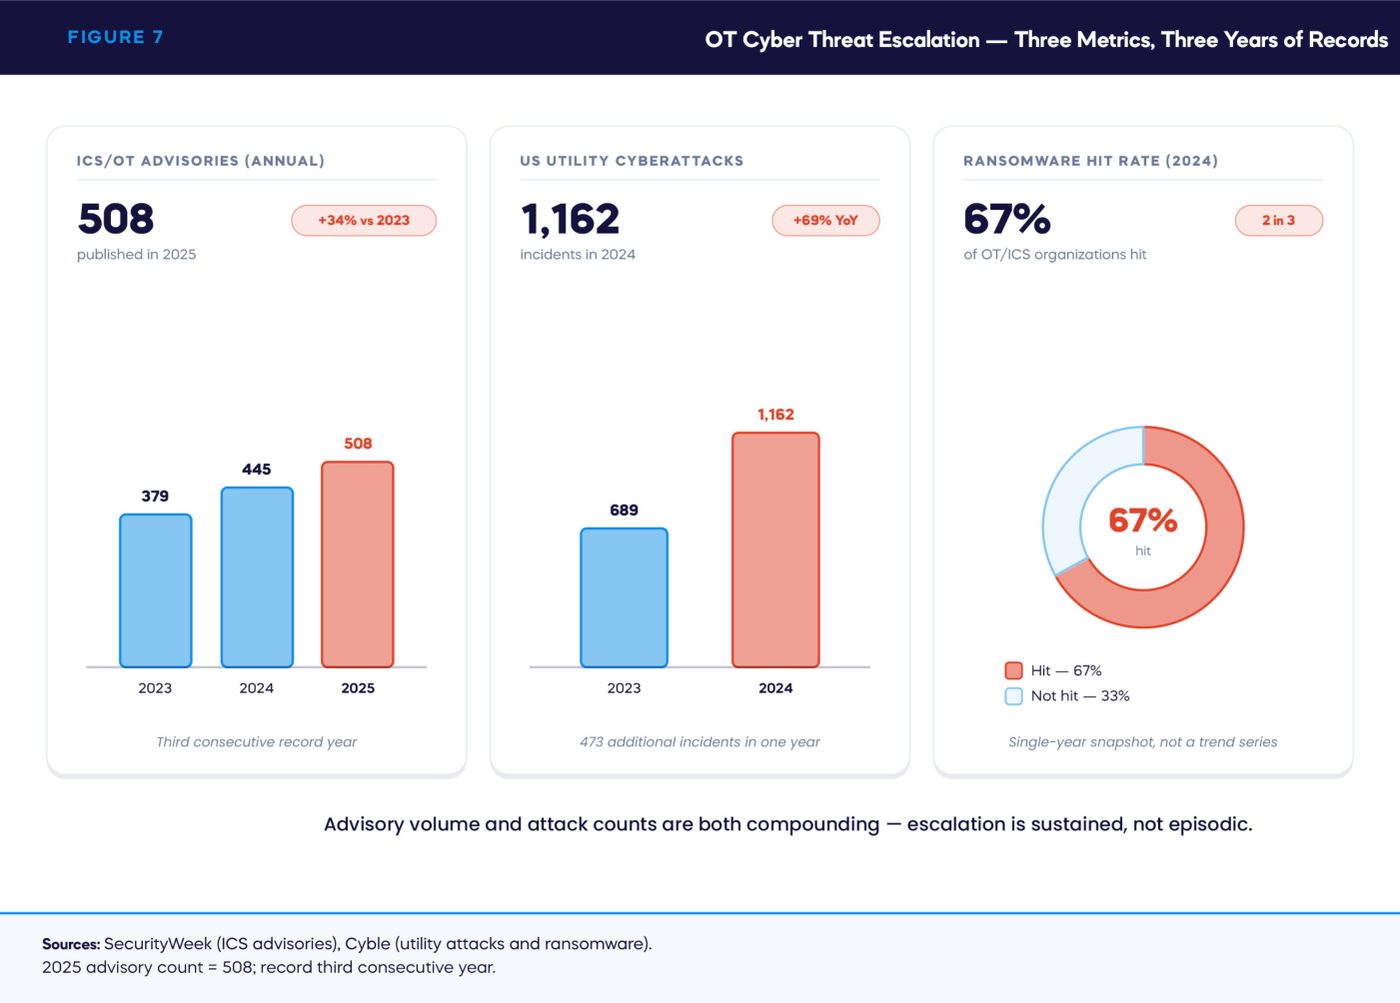
FIGURE 6 — The OT Risk Iceberg — Where Security Investment Ends and Exposure Begins
FIGURE 7 — OT Cyber Threat Escalation — Three Metrics, Three Years of Records

The Threat Actors

Three threat actor categories are active against the OT systems relevant to AI data center infrastructure. They are not equivalent in capability or intent, but they are increasingly convergent in the tools they use.

Sources: Waterfall Security, Tenable, Claroty, Asimily, IoT Analytics, IEA, Belfer Center/Harvard. DeNexus analysis.

FIGURE 8 — Nation-State Threat Actors Targeting US AI Data Center Infrastructure
TABLE 3 — The OT Attack Surface — The Iceberg Model
LayerWhat It ContainsVisibilityCurrent Security CoverageConsequence of Compromise
IT Layer
(Above the waterline)
Corporate networks, email, applications, endpoint devices, cloud servicesHIGHEDR, SIEM, SOC, patching, cyber insurance — well-developedData breach, ransomware demand, reputational damage — recoverableCRITICAL — HIGHEST PROBABILITY
Network OT
(Near surface)
NOC systems, fiber management, DC interconnect (DCI), subsea cable terminationPARTIALPhysical security, some network monitoring — inconsistentConnectivity loss, revenue outage — significant but bounded
Shared Infrastructure
(IT/OT bridge — most dangerous layer)
Active Directory (AD DS), virtualization hypervisor management (VMware vCenter, Hyper-V), SNMP and WMI network management, multi-factor authentication (MFA) systems, secure remote access (SRA/VPN), PKI certificate infrastructure, identity and access management (IAM)PARTIAL — often mistakenly treated as IT-only. AD domain joins, shared management planes, and converged remote access mean this layer is simultaneously inside both the corporate IT network and the OT infrastructure management plane.AD compromise → lateral movement to OT management consoles. Hypervisor compromise → simultaneous control of virtualized BMS, DCIM, and SCADA management platforms. MFA/SRA compromise → attacker gains authenticated access to both corporate network and OT remote access simultaneously. A single attack on this layer disrupts both the DC operator's business network AND the OT infrastructure running the data center.Often none specific to this layer. AD security is treated as IT problem; OT consequences not modeled. Shared management planes are almost never segmented. This is the layer where living-off-the-land (LotL) attacks are most effective because legitimate tools are used throughout.
Building OT
(Below the waterline)
BMS (HVAC, fire suppression, access control), DCIM, cooling tower controls, UPS managementLOWAlmost none. 75% of BMS have KEVs. Most are internet-connected for remote management. No mandatory security standard.[3]Thermal event, fire suppression discharge, physical access compromise, widespread hardware damage — severe
Power Generation OT
(Deepest — highest consequence)
Gas turbine DCS, generator governor controls, switchgear SCADA, transformer protection relays, BTM power managementVERY LOWNone in most BTM deployments. No NERC CIP obligation for non-BES facilities. Entirely uncovered by standard insurance.Forced outage, equipment damage (turbine trip, transformer failure), prolonged downtime, unplanned CapEx, cascade across facility — catastrophic

Sources: Claroty, Asimily[28], Tenable, Waterfall Security, Baldwin Group, NERC CIP standards. [87] DeNexus OT risk framework.

The Key Data Points

The following are not projections. They are observed, published facts about the current OT security posture in US critical infrastructure — directly applicable to the data center power and facility ecosystem.

75%
BMS with Known Exploitable Vulnerabilities (KEVs) — many linked to active ransomware campaigns (Claroty)
<10%
OT environments with active monitoring capable of detecting an attack in progress (Forescout[2])
-7days
Mean time to exploit in 2026 — exploitation precedes the patch (Mandiant / WEF 2026 [45])
67%
Energy sector organizations hit by ransomware in 2024; 80% resulted in successful encryption (Cyble [47])
+40%
Rise in internet-exposed ICS devices 2024–2025. Attack surface expanding faster than patching. (CISA [46])
2,155
ICS/OT CVEs in 2025 — all-time record, ~6 per day. 82% rated high/critical. CVSS avg >8.0 (CISA [47])
+70%
Year-on-year US utility cyberattacks — 689 (2023) → 1,162 (2024) (Cyble [4])
3,900
US Allen-Bradley PLCs internet-exposed via cellular + Starlink — same PLC types in AI DC BTM generation (CISA)

The Threat Actors

Three threat actor categories are active against the OT systems relevant to AI data center infrastructure. They are not equivalent in capability or intent, but they are increasingly convergent in the tools they use.

TABLE 4 — Threat Actor Taxonomy and Capability Matrix
Actor CategoryNamed Groups/ToolsPrimary TargetConfirmed ActivityIntentInsurance Implication
Nation-StateVolt Typhoon (PRC), Salt Typhoon (PRC), Flax Typhoon (PRC), BAUXITEUS energy, telecoms, water, dcs — 18 named US technology companies on IRGC formal ISR target list (apple, google, [49]microsoft, NVIDIA, oracle, meta). Volt typhoon maintained ~300-day average dwell inside US electric grid. [48] China acknowledged the campaign via state media december 2024.Confirmed pre-positioning in US ICS environments; Salt Typhoon: CISA assessed Digital Realty as likely/potentially compromised in the 2025 telecom-espionage campaign (no confirmed OT impact).; BAUXITE actively exploiting Rockwell PLCs in US energyPre-positioning for disruption in a geopolitical conflict scenario — Taiwan trigger most citedWar exclusion applies — most cyber policies now exclude nation-state attacks on critical infrastructure
Criminal / RansomwareVoltRuptor (ICS-specific malware), LockBit variants, Cl0pEnergy sector (highest priority target), OT environments with known KEVs67% energy sector hit rate; OT-specific ransomware toolkits now widely available; VoltRuptor confirmed multi-protocol, multi-vendor OT targetingFinancial extortion — ransom demand + encrypted OT systems = operational shutdownCovered by cyber policies in principle — but BMS/OT coverage gaps and BI definitions often exclude physical-cyber events
HacktivistPro-Palestinian groups, IRGC-affiliated actors, geopolitically-motivatedHigh-visibility AI infrastructure — politically appealing targets; HVAC and power systems as primary OT targetsDirect ICS/OT attacks confirmed, not just IT disruption; politically-motivated SCADA attacks documented in 2025–2026Disruption and reputational damage — not primarily financialOften covered — but frequency and physical-cyber boundary increasingly contested

Sources: RUSI, SecurityWeek, Industrial Cyber, Waterfall Security 2026 Threat Report, CISA ICS-CERT advisories. [26][26] DeNexus threat intelligence framework.

The IT/OT Convergence Accelerant

Note: Table 5 documents OT cyber events in the broader AI infrastructure ecosystem. For confirmed data center-specific infrastructure outages, see Table 2.

The historical defense for OT security was air-gapping — physical isolation of OT networks from IT networks and the internet. That defense is gone. Modern data centers deploy DCIM platforms that sit at the IT/OT boundary, providing management visibility across both. Mitsubishi's Iconics SCADA system is now being positioned explicitly as a DCIM solution — OT protocol at the IT management layer. Vendor remote access for turbine maintenance, cooling system calibration, and BMS diagnostics creates permanent bridge points that attackers have learned to exploit. The air-gap assumption is false for the vast majority of operating data centers.

Defensive capacity is declining as offensive threats accelerate. CISA lost approximately one-third of its workforce in 2025–2026. [50] The CSRB was disbanded. The JCDC collapsed from 100+ to ~10 contractors — effectively ending public-private OT coordination. This occurred during peak Volt Typhoon, Salt Typhoon, and IRGC activity. (CISA / Trend Micro Q1 2026)[45] A new accelerant: AI-powered attack tooling. SentinelOne, Experian, and Trend Micro all flag AI-enhanced attack capabilities as a defining feature of the 2026 threat landscape. AI is enabling faster reconnaissance, automated payload development, and more sophisticated lateral movement across complex enterprise networks. Nation-state actors now use AI to move through IT networks toward OT targets with a speed and precision that traditional detection systems were not designed to match. Trend Micro's Q1 2026 intelligence confirms AI-enhanced tooling enabled simultaneous targeting of US energy, water, and transportation infrastructure in a coordinated multi-sector campaign. The WEF Global Cybersecurity Outlook 2026 found 87% of cyber leaders identify AI vulnerabilities as the fastest-growing risk category. [45] AI lowers the barrier for tier-2 nation-state actors to conduct sophisticated OT operations.

Tenable's 2026 analysis identifies converged IT/OT attacks — where an adversary moves laterally from a corporate network to sabotage physical components like cooling or power — as the biggest risk in data center security this year. The documented attack path runs: corporate network → DCIM/BMS → physical infrastructure (Figure 9) control → forced outage or equipment damage. This is not theoretical. It is the pattern of actual incidents.
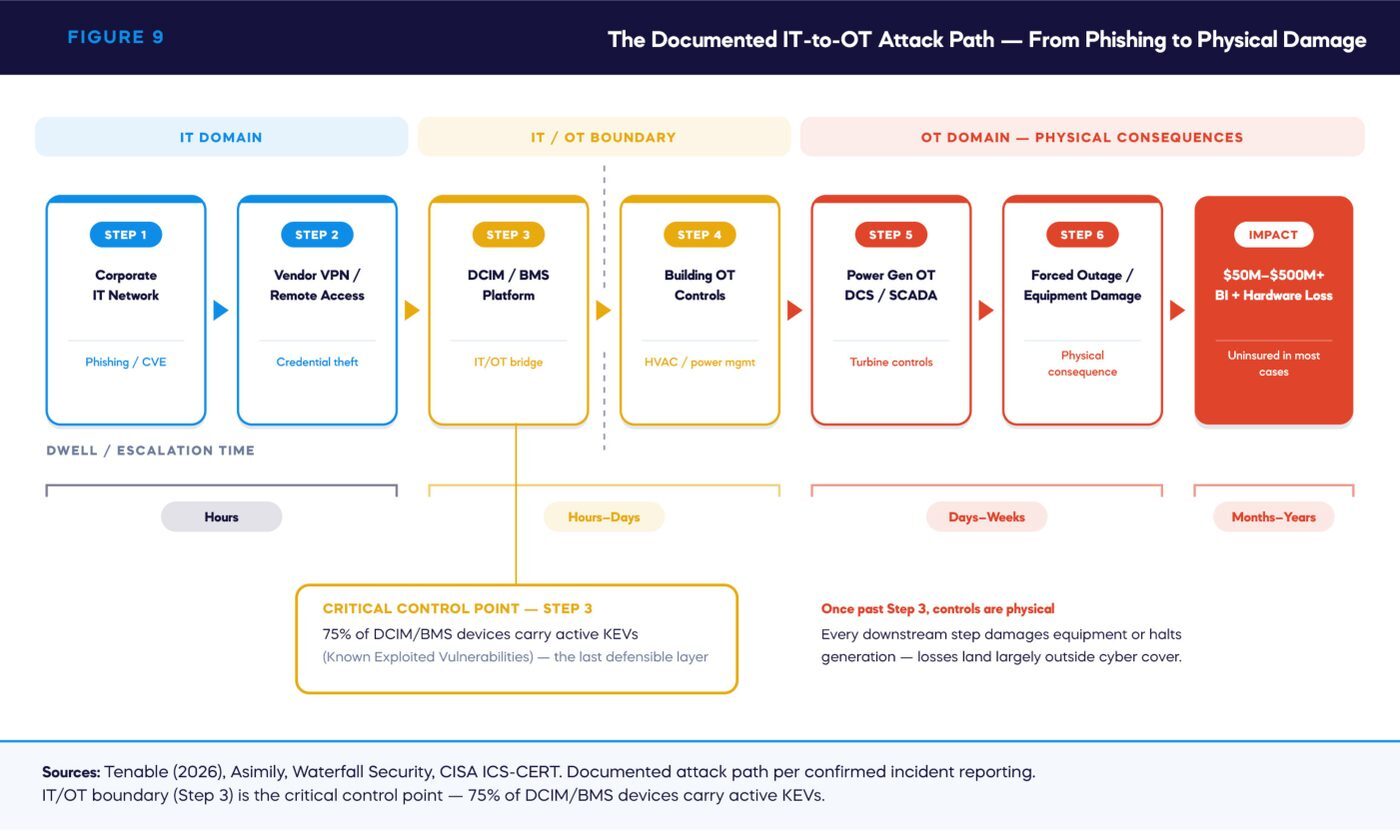
The Documented IT/OT Lateral Movement Attack Path

The financial impact is no longer hypothetical. In March 2026, Iran-linked Handala group wiped 40,000 Stryker Corporation laptops via Microsoft Intune abuse — a wiper attack that shut down manufacturing and shipping for three weeks. Stryker's Q1 2026 earnings revealed a ~$317 million revenue miss against consensus, with analysts estimating $62–140 million in total financial impact. This is the first confirmed hard-dollar P&L anchor for a destructive OT-adjacent cyber attack by an IRGC-linked actor on a US industrial company — the same class of actor (BAUXITE/CyberAv3ngers) actively exploiting Rockwell PLCs in US energy infrastructure.[51]

Data center operators themselves are not immune to ransomware with OT propagation risk. CloudNordic[52] suffered a ransomware attack that resulted in complete data loss for all customers — the most severe DC outcome documented, with backup infrastructure simultaneously compromised. CyrusOne experienced a REvil-attributed attack that spread across multiple colocation facilities via networked DC environments. Equinix received a $4.5 million ransom demand from Netwalker and refused to pay, containing the incident through operational segmentation. All three filed business interruption insurance claims. The pattern is consistent: ransomware entering via the IT layer can propagate to OT-managed cooling, power, and physical access systems — precisely the Shared Infrastructure convergence risk documented in Table 3.

The vulnerabilities are now named and specific. In June 2026, Claroty's Team82 disclosed at SANS ICS Orlando a chained exploit against Vertiv Liebert IS-UNITY-DP UPS network cards — authentication bypass combined with remote code execution — allowing an attacker to remotely take over UPS systems and execute arbitrary code on the power management layer. A companion disclosure targeted Trane HVAC controllers. CISA issued advisories on both. These are the first named-device CVEs specifically targeting data center UPS and HVAC OT equipment[53] — not abstract ICS vulnerabilities, but exploits against the exact hardware deployed in the facilities described throughout this analysis. The Vertiv UPS is the device sitting between grid power and the GPU racks. The Trane controller manages the cooling that prevents thermal shutdown. Both are now confirmed remotely exploitable.

FIGURE 9 — The Documented IT-to-OT Attack Path — From Phishing to Physical Damage
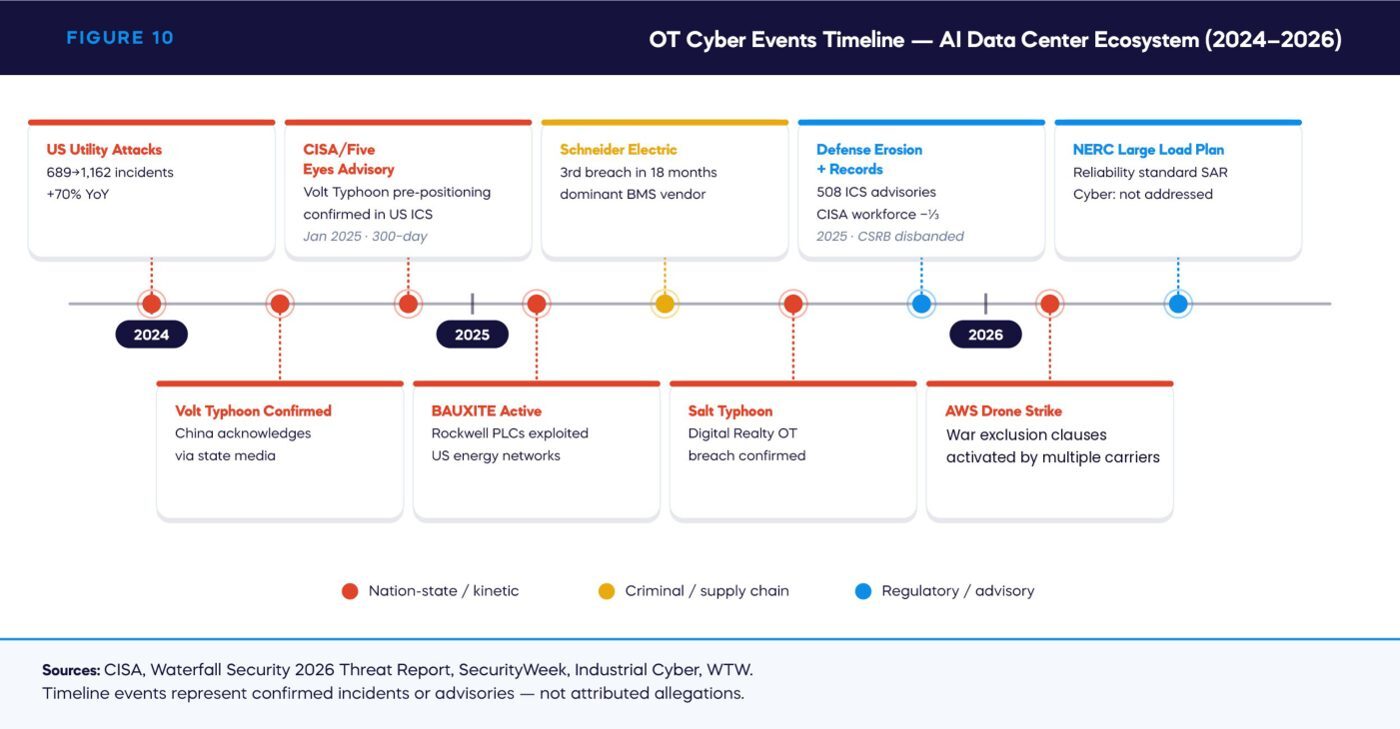
FIGURE 10 — OT Cyber Events Timeline — AI Data Center Ecosystem (2024–2026)
TABLE 5 — Threat Actor Taxonomy and Capability Matrix
DateEventOT/ICS RelevanceImplication
2024US utility cyberattacks reach 1,162 incidents — +70% YoYEnergy sector OT (generation, T&D, grid control)Baseline threat level for power infrastructure serving DCs has materially escalated
Jan 2025CISA/Five Eyes joint advisory confirms Volt Typhoon pre-positioning in US critical infrastructure "for potential conflict"[1]Energy, water, telecom OT systems — all DC-adjacentNation-state actors are already inside the infrastructure. This is not hypothetical.
Mid 2025VoltRuptor ICS-specific malware confirmed — multi-protocol, multi-vendor OT targetingPLCs, DCS, SCADA across energy sectorCriminal actors now have OT-specific toolkits — barrier to OT attack significantly reduced
Jun 2025Salt Typhoon: CISA assessed Digital Realty as a likely target in the telecom-espionage campaign.Company reported no confirmed OT impactSignal: nation-state actors are reaching toward hyperscale DC operators
2025Schneider Electric (dominant BMS vendor) suffers 3 documented breaches in 18 monthsBMS supply chain — affects facilities globallyOT vendor compromise = simultaneous exposure across thousands of facilities
2025BAUXITE group confirmed actively exploiting Rockwell PLCs in US energy/water/government networksPLCs in power generation and water treatment adjacent to DCsAttack capability against specific hardware in DC-adjacent infrastructure is confirmed and active
2026ICS advisories reach 508 in 2025 — third consecutive year of records; mean time to exploit turns negativeAll OT/ICS hardware including BMS, SCADA, DCSExploits appearing before patches — proactive OT security now the only viable defense posture
2026Drone strikes on AWS infrastructure documented — war exclusion clauses activated by multiple carriersPhysical-kinetic intersection with cyber; OT physically damagedThe kinetic-cyber boundary is dissolving; war exclusion language increasingly contested

Sources: CISA, Waterfall Security 2026 Threat Report, Industrial Cyber, SecurityWeek, WTW Insurance Marketplace Realities 2026. DeNexus research synthesis.

SECTION 04

Infrastructure-by-Infrastructure Risk Analysis

THROUGH YOUR LENS · DATA CENTER OPERATOR

Layer by layer — turbines, transformers, UPS, cooling, BMS — this section profiles the OT risk of the specific equipment classes running your facility, including the first named-device CVEs against data center UPS and HVAC hardware.

THROUGH YOUR LENS · PE INFRA INVESTOR

Read this as the technical annex to your diligence model: per-layer risk profiles for the physical systems whose failure modes determine asset downtime — and therefore revenue and valuation.

THROUGH YOUR LENS · LENDER

The equipment documented here is the collateral: gas turbines with 5–7 year lead times, transformers at 2–4 years. Replacement timelines define recovery timelines — and recovery timelines define loss-given-default on a stressed asset.

THROUGH YOUR LENS · INSURER / REINSURER

This is the schedule-of-values view: per-layer OT risk profiles for the asset classes underwriters are being asked to cover — with the loss-history vacuum the section documents at hyperscale.

The following analysis examines each of the seven infrastructure pillars in turn — the specific OT attack surface, the primary risk vectors, the loss scenario, and the current defensive posture. This is the level of granularity that investors, lenders, and insurers need to move from qualitative concern to quantified exposure.

TABLE 6 — OT Risk Profile by Infrastructure Layer — AI Data Center Ecosystem
Infrastructure LayerPrimary OT Systems at RiskAttack VectorLoss ScenarioCurrent Defensive PostureResidual Risk
Power Generation (BTM)Gas turbine DCS; diesel generator governor controls; automatic transfer switches; battery energy storage management systems (BEMS)Remote access to turbine DCS via vendor VPN; IT/OT convergence through DCIM; supply chain attack on DCS software updateCoordinated generator trip across BTM fleet → facility-wide power loss → GPU rack thermal event → $50M–500M hardware damage + prolonged BIMinimal. No NERC CIP obligation for BTM facilities. Most DC operators have no OT monitoring. Vendor remote access largely uncontrolled.[54]CRITICAL — UNMANAGED
Electrical Transmission (Grid)High-voltage substation SCADA; protection relays (overcurrent, differential); transformer monitoring systems; PJM/ERCOT EMS interfaces[83]Substation SCADA compromise (Volt Typhoon pre-positioning confirmed); relay misconfiguration causing transformer failure; EMS data manipulationTransformer failure (12–18 month replacement lead time) → extended facility outage → revenue loss + contractual default + potential total loss of siteNERC CIP applies to BES (Bulk Electric System) — but many DC-adjacent substations fall below threshold. Monitoring inconsistent.HIGH — PARTIALLY MANAGED
Telecommunications / FiberNetwork Operations Center (NOC) control systems; subsea cable landing station OT; dark fiber Optical Management Systems (OMS); amplifier station controlsNOC compromise via IT network lateral movement; physical cut at choke points; subsea cable landing station OT attackConnectivity disruption → SLA breach → contract default → revenue outage. Subsea cable: 98%+ of international internet traffic at risk from concentrated landing points.Physical security at landing stations; some network segmentation. No sector-wide OT security standard for telecom OT.HIGH
HVAC / Thermal ManagementCRAC/CRAH unit controllers, precision air conditioning BMS, hot/cold aisle containment PLCs, airflow management sensors, temperature/humidity monitoring systemsHVAC BMS compromise causing temperature manipulation; CRAC unit control manipulation; cooling bypass enabling thermal runaway; direct entry via HVAC vendor remote accessHVAC failure → thermal runaway → server auto-shutdown → BI loss + hardware damage. Confirmed real-world cascade: AWS US-East-1 (May 2026) — cooling failure → EC2/EBS shutdown → multi-hour outage across Northern Virginia. Google London (July 2022) — simultaneous cooling failure → full facility shutdown.Almost none. HVAC BMS is the primary documented attack entry vector into DC OT. 75% of BMS carry KEVs. Most HVAC systems remotely accessible for vendor maintenance. Uptime Institute: cooling failures cause 19% of all impactful outages.[36]CRITICAL — HIGHEST FREQUENCY
Water Systems
(Support to HVAC)
Chilled water loop SCADA; cooling tower PLC; chiller plant BMS; water treatment automation (chemical dosing, filtration); pump/valve controls; humidification controllersBMS entry → chiller control manipulation; water treatment PLC attack (Oldsmar model); chilled water loop disruption causing HVAC capacity loss; municipal supply disruptionChiller failure → loss of chilled water to HVAC → thermal cascade. Azure VVTQ-J98 (Aug 2023): utility power sag → chiller plant tripped offline for two data halls → hardware physically damaged. Water scarcity: 731M–1,125M cubic meters/year US demand by 2030 — scarcity limits site options.Limited. Water treatment PLC attacks demonstrated by Oldsmar (2021). Chiller plant BMS monitoring rare. Chiller failure rate amplified by AI GPU heat loads.HIGH
Fuel / Natural Gas SupplyPipeline SCADA (upstream, midstream); compressor station controls; on-site gas metering and pressure regulation; BTM fuel management systemsPipeline SCADA attack (supply chain OT compromise model); compressor station OT compromise; metering system manipulation; physical pipeline attackFuel starvation → BTM turbine trip → facility power loss. The IT→OT cascade model demonstrated at Colonial Pipeline (2021): IT ransomware → precautionary OT shutdown → 6-day supply disruption.CISA TSA pipeline cybersecurity directives in place — but enforcement and coverage inconsistent. BTM fuel management on-site largely unregulated.HIGH
Intra-Facility OT (BMS/DCIM)Building Management System (BMS): HVAC, fire suppression, access control, lighting, power management. DCIM platform. UPS management. Electronic Power Management System (EPMS) — balances user demand against server load and heat generated; enables operators to constrain or shed load if power or temperature thresholds are exceeded in a data hall. Emergency power-off (EPO) systems.BMS is the primary documented entry vector. 75% have KEVs. Internet-connected for remote management. DCIM is the IT/OT bridge — if compromised, provides both network access and physical infrastructure control.BMS → HVAC manipulation → thermal event → hardware damage. OR: BMS → fire suppression activation → facility damage + data loss. OR: DCIM compromise → EPO activation → immediate full-facility power shutdown.Almost none. No mandatory OT security baseline for customer-owned DC infrastructure outside NERC BES. Air-gap assumption false — most BMS internet-connected.[54]CRITICAL — HIGHEST PROBABILITY

Sources: Claroty, Tenable, Asimily, Waterfall Security, Avid Solutions, CISA, Industrial Cyber, Lockton, SC Media. [71]DeNexus operational risk framework.

The compound pipeline–BTM cascade: a scenario no current model prices. The NERC 2025 LTRA confirms that new BTM gas-fired capacity at AI data centers could consume 6–11 BCF/day at peak winter. Volt Typhoon and BAUXITE are both pre-positioned in pipeline SCADA systems. A coordinated attack on upstream pipeline SCADA simultaneously starves BTM turbines of gas fuel AND disrupts grid gas delivery broadly. Single attack vector, two cascades — AI DC power loss plus regional gas supply disruption. No current insurance product models this. No regulation mandates defenses against it.

The fuel supply chain risk is sharpening. AI data center natural gas consumption is projected to reach approximately 6.5 Bcf per day by 2035, with the East region driving the majority of growth. GE [55] Vernova[56] and Mitsubishi turbine order books are sold out through 2028–2030, creating 5–7 year replacement lead times for any turbine lost to a cyber-physical event. Older turbines kept in service consume roughly 30% more fuel — an aging OT attack surface multiplier. The cascade scenario is concrete: a pipeline SCADA compromise disrupts gas supply to a BTM plant, which trips the turbines, which takes an AI data center offline.

The generation fleet supporting these data centers is simultaneously degrading. NERC's 2026 State of Reliability report found that the weighted equivalent forced outage rate (WEFOR) hit 9.2% in 2025 — well above the historical 7–8% norm. Coal generation WEFOR reached 14.1%; combined-cycle gas turbines — the same units being deployed as BTM generation at AI data centers — reached 5.7%. The root cause is aging fleets being cycled in ways they were never designed for, with supply chain constraints extending outage durations. Overworked assets with deferred maintenance and stretched operations teams are precisely the environment in which OT exploits succeed: the human attention and equipment resilience that would normally catch or contain an attack are already depleted by mechanical stress.[35]

The most extreme case is already operational. xAI's Colossus facility in Tennessee/Mississippi runs approximately 770,000 GPUs across three buildings — two of which are fully off-grid, powered entirely by on-site natural gas generators. It is the largest documented islanded AI DC cluster in the world. When environmental groups filed a Clean Air Act suit against the off-grid power plant, the US Department of Justice intervened on national-security grounds to protect it — the first documented case of AI data center power infrastructure receiving DOJ national-security shielding from environmental regulation. Anthropic pays approximately $1.25 billion per month to lease Colossus compute for Claude inference. [33] An OT attack on those gas generators — the same pipeline SCADA and turbine control systems discussed throughout this section — would destroy $1.25 billion per month in committed AI inference capacity. The generators are the OT. The OT is the revenue. There is no separation.

The kinetic gap: hyperscalers are legally defenseless against drones. The March 2026 AWS strikes (UAE and Bahrain) — 116 commercial drones at ~$200 each, 5,000km operational range — caused month-long outages to cooling and power OT infrastructure. A critical legal dimension: private US critical infrastructure operators currently have no legal authority to deploy counter-drone countermeasures. A bill extending that authority was introduced April 2026. It has not passed. Hyperscalers facing drone attacks must wait for federal response. (Counter-UAS legislation, April 2026)

A Note on HVAC and Water Risk

HVAC deserves specific attention as the highest-frequency OT failure category in data centers. Uptime Institute's 2025 data identifies cooling failures as the cause of 19% of all impactful data center outages — the second-leading cause behind power failures.[36] With AI GPU rack densities, the thermal management challenge is structurally worse than in the CPU era: higher heat loads, faster thermal runaway when cooling falters, and less recovery time before hardware enters protective shutdown. The documented incidents are recent and unambiguous: AWS US-East-1 (May 2026), Google Cloud London (July 2022), Azure Australia East (August 2023). All followed the same cascade: HVAC/cooling failure → thermal rise → hardware protection shutdown → extended BI loss. The HVAC control systems — CRAC unit BMS, chiller plant controllers, airflow management PLCs — are precisely the OT systems that are monitored least and secured least.

Water deserves specific attention as the support system that makes HVAC function. It is not a passive utility supply — it is the thermal transfer medium for chilled water cooling loops, the source of evaporative cooling in towers, and the humidity control medium for server environments. Nature Sustainability projects that AI servers in the United States will consume30 731–1,125 million cubic meters of water annually by 2030 — driven by the heat loads of GPU-dense racks that require substantially more cooling than CPU-era data centers. Direct operational water consumption runs approximately 24 times the supply chain water footprint. This creates physical risk in drought-prone markets (Phoenix, Texas), regulatory risk as municipal water authorities increasingly scrutinize data center consumption, and operational risk as water treatment OT becomes a higher-profile attack target.

SECTION 05

Financial Risk — CapEx, OpEx, and the Balance Sheet Under Stress

THROUGH YOUR LENS · DATA CENTER OPERATOR

CapEx compression is an operating constraint: when free cash flow tightens — Microsoft −28%, Alphabet projected to ~$8.2B — security and resilience budgets compete with expansion for the same dollars. The $3–5M per MW per year OpEx reality is your P&L.

THROUGH YOUR LENS · PE INFRA INVESTOR

The compression is the entry-multiple story: Amazon projected to run negative FCF in 2026, over $100B in hyperscaler bonds issued, and $10–15M per MW to build. This section quantifies the balance-sheet stress underneath the growth narrative.

THROUGH YOUR LENS · LENDER

This is your section. Investment-grade ratings hold, but "the buffer between operating earnings and financial obligations has compressed substantially" — and the bonds funding the buildout sit senior to nothing that covers an uninsured OT loss.

THROUGH YOUR LENS · INSURER / REINSURER

A 1 GW campus holds $35B in NVIDIA GPU hardware at confirmed pricing; a cooling OT failure destroying 10% of GPU inventory represents $3.5–5B in hardware loss with a 36–52 week replacement timeline. That is the severity distribution behind the premium.

The CapEx Surge and Its Credit Consequences

The hyperscaler capital expenditure cycle now underway is, in the words of CreditSights, "the largest CapEx cycle in tech history."[58] The numbers are striking in isolation. In combination with the cash flow dynamics they produce, they represent a material shift in the credit profiles of the organizations at the center of this buildout.

Microsoft's free cash flow fell 28% (Figure 11) year-on-year as CapEx consumed cash generation. Alphabet's FCF projected to fall approximately 90% (Figure 11) to $8.2 billion from $73.3 billion — despite strong EBITDA. Amazon is projected to run negative FCF in 2026. All three maintain investment-grade ratings, but the buffer between operating earnings and financial obligations has compressed substantially. They have responded by issuing investment-grade bonds at scale: Microsoft issued $10 billion in January 2026, Amazon $18 billion in February 2026. Over $100 billion in bonds has been issued by hyperscalers to partially fund the buildout.

The losses are real and already occurring. The 2025 OT Security Financial Risk Report by Dragos and Marsh McLennan models $329.5 billion[100] in annual global OT cyber risk exposure — a 1-in-250 tail scenario (0.4% annual likelihood), drawn from Marsh McLennan’s proprietary claims data. This is the actuarial scale of OT cyber risk: the loss category most AI data center underwriting models still leave out entirely. Lenders and investors who are modeling AI data center risk without an OT loss component are missing a category of loss that is already materializing at scale.

Goldman Sachs has separately raised an ROI question that deserves attention from every investor in this space: the firm projects that $1 trillion in annual AI profit is needed to justify the current investment trajectory, against an analyst consensus of approximately $450 billion — a 2:1 gap. The implied question — whether the AI infrastructure buildout will generate sufficient returns to service the capital deployed — is not yet resolved.[13]
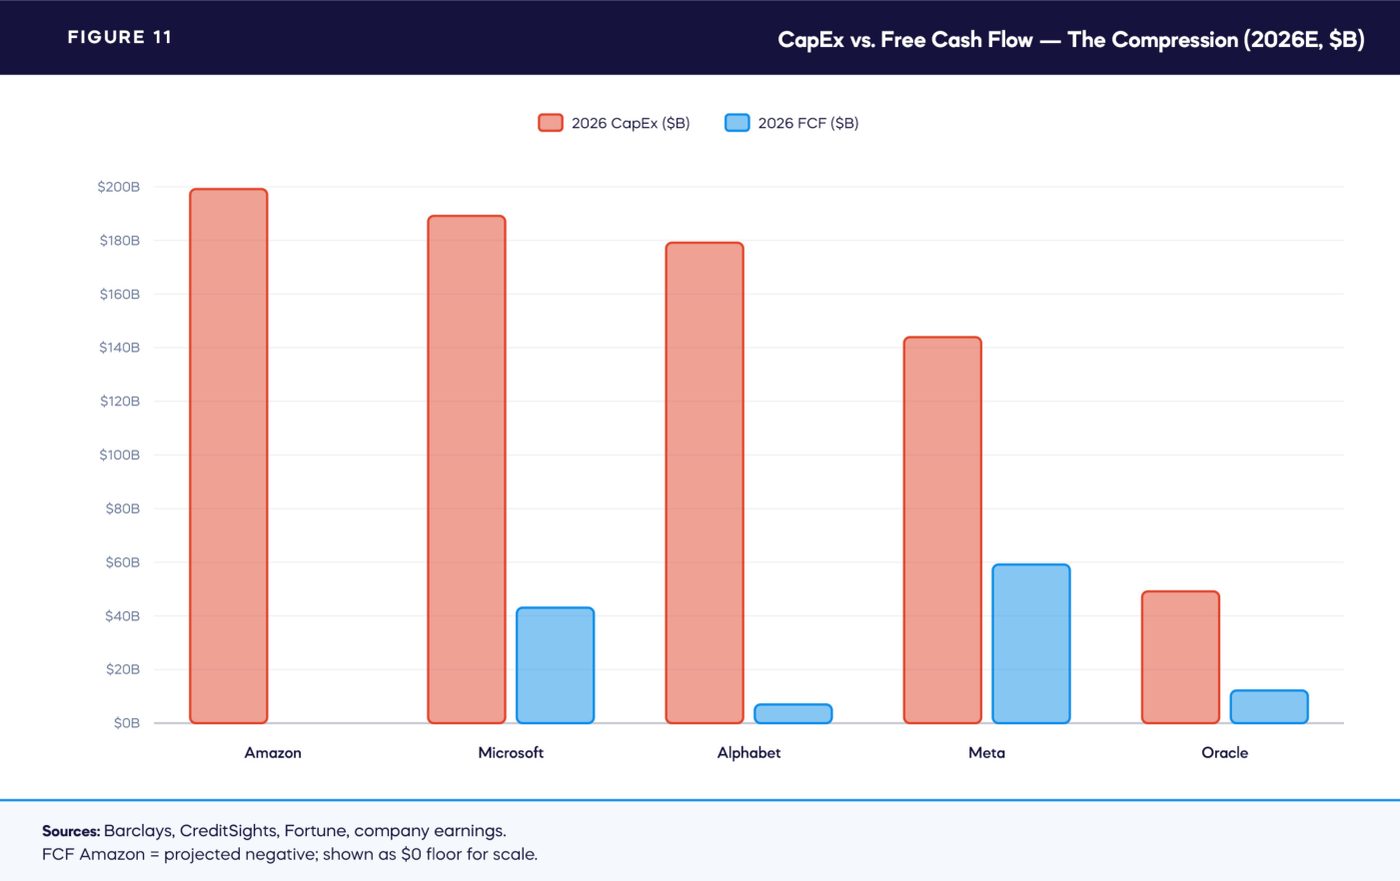
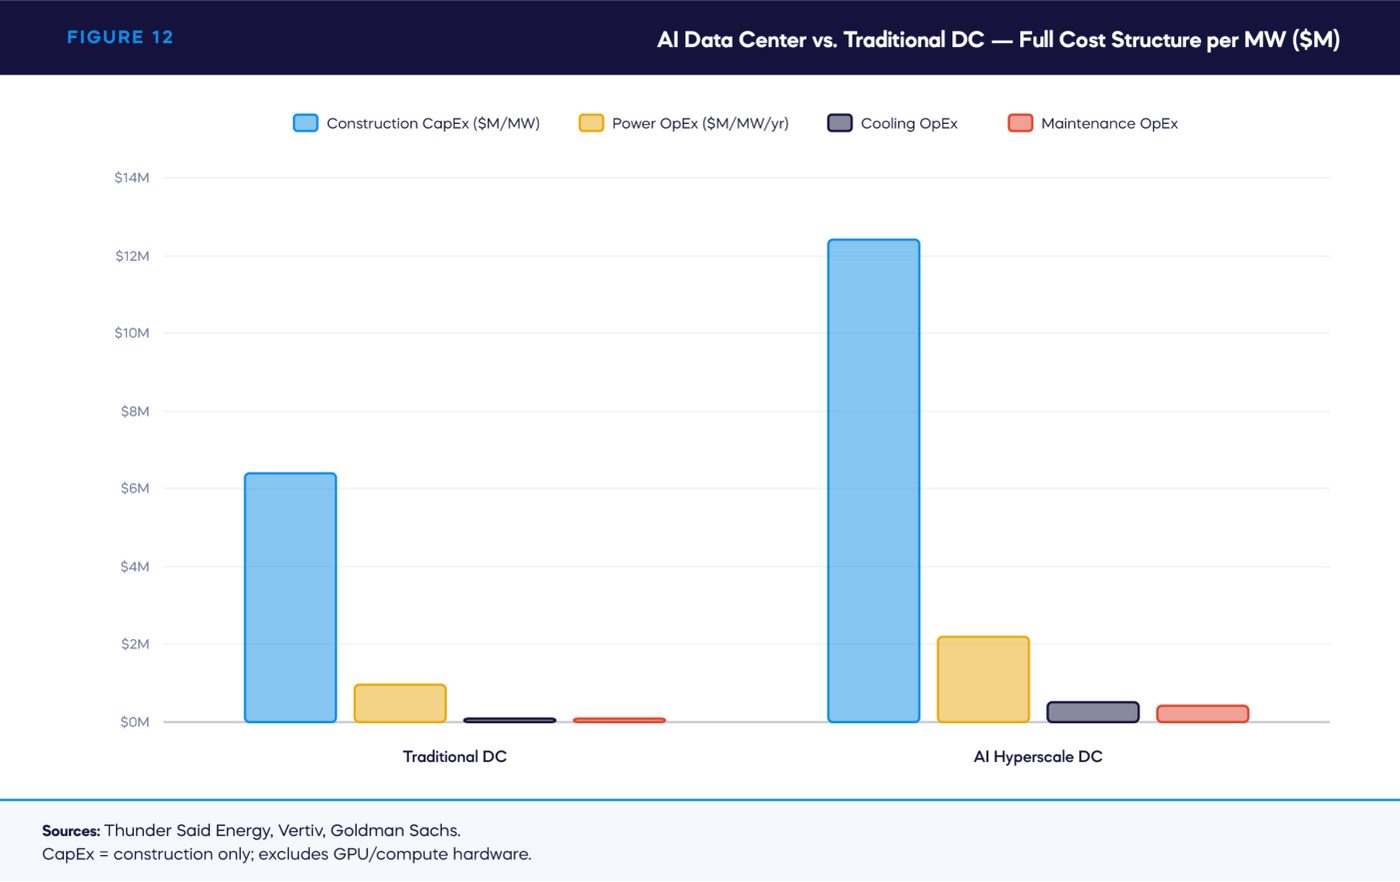
FIGURE 11 — CapEx vs. Free Cash Flow — The Compression (2026E, $B)
TABLE 7 — Big 5 Hyperscaler CapEx and Free Cash Flow Evolution (2024–2027E)
Company2024 CapEx2026 CapEx (Est.)FCF DirectionBond Issuance (2025–2026)Credit Risk Signal
Microsoft~$55B$190B+−28% YoY$10B (Jan 2026)FCF compression; CapEx consuming cash generation
Alphabet (Google)~$52B$175–185B−90% YoY projectedMonitoring; Google Cloud backlog $462BSevere FCF collapse; supply-constrained AI inference growth
Amazon (AWS)~$75B$200BNegative FCF projected$18B (Feb 2026)Largest single CapEx commitment; negative FCF period
Meta~$38B$145BMonitoringLargest single-year CapEx increase in company historyScale of ramp-up creates execution risk
Oracle~$10B$50B targetMonitoringHighest growth rate among Big 5Smallest absolute base; execution risk on acceleration
Combined Big 5~$230B$660–725BStructural FCF pressure$100B+ combined2027 projected to exceed $1T — first time in history

Sources: Futurum Group, CreditSights[58], CNBC/Evercore ISI, Fortune, Barclays. Company earnings filings.

Operating Economics — Power as the Dominant Variable

The operating economics of AI data centers differ fundamentally from traditional data centers. Power costs — energy procurement, cooling, and power infrastructure maintenance — represent 40–60% of operating expenditure. Thunder Said Energy estimates total cost at $3–5 million per megawatt per year (Figure 12) for hyperscale AI facilities. CapEx to build runs $10–15 million per megawatt (Figure 12) — roughly double the cost of a traditional data center. The aphorism captures it accurately: data centers are becoming large energy businesses, not IT infrastructure.

NVIDIA CEO Jensen Huang quantified the total cost in June 2026: a single 1 GW AI data center campus on NVIDIA architecture costs approximately $100 billion to build — with $35 billion of that going directly to NVIDIA for GPUs, networking, and systems. The remaining $50–65 billion covers land, buildings, power infrastructure (BTM turbines, substations, UPS), cooling systems, and non-NVIDIA components. This makes a hyperscale AI campus the most expensive per-square-foot asset class ever constructed. A cooling OT failure that destroys even 10% of the GPU inventory in a single facility represents $3.5–5 billion in hardware loss — with a 36–52 week replacement timeline for NVIDIA H100/H200/Blackwell-class GPUs. The NVIDIA-OpenAI Stargate deal (up to 10 GW, ~$500 billion in GPU hardware alone) structures this exposure as a leasing arrangement where NVIDIA bears more of the financing risk, but the physical OT risk — the cooling failure, the power sag, the BMS compromise — remains with the facility operator.[19][60]

This has direct implications for operators deploying BTM generation. Gas turbine OEMs acknowledge extended lead times in commercial materials. Some operators are deploying older turbines — 30% less efficient than new units, with correspondingly higher fuel costs and with aging OT systems carrying deferred maintenance backlogs. The operational and cyber risk of running aging industrial control systems in a high-stakes environment is compounding.

TABLE 8 — AI Data Center Cost Structure — CapEx and OpEx per Megawatt
Cost CategoryTraditional DC ($/MW)AI Hyperscale DC ($/MW)Key DriverRisk Implication
CapEx — Construction$5–8M/MW$10–15M/MWAI rack density, power infrastructure, BTM generationHigher asset value at risk per MW; longer payback period
CapEx — GPU/Compute$0.5–1M/MW$5–10M/MWNVIDIA H100/B200 rack costs; 36–52 week lead timesGPU replacement risk; supply chain concentration (TSMC 92% market share)[92]
OpEx — Power/Energy$0.8–1.2M/MW/yr$1.5–3M/MW/yrAI workload PUE; BTM fuel costs; grid electricity rates risingCommodity price exposure; rate increases from utility capital recovery
OpEx — CoolingIncluded in powerAddl. $0.3–0.8M/MW/yrLiquid cooling for GPU thermal loads; water costsWater scarcity risk; cooling OT reliability
OpEx — Maintenance/OT$0.1–0.2M/MW/yr$0.3–0.6M/MW/yrBTM turbine maintenance; OT system upkeep; lead timesDeferred maintenance = growing OT attack surface
Total Annual Cost~$1.5–2M/MW/yr~$3–5M/MW/yrEvery operational disruption event hits a significantly higher cost base

Sources: Thunder Said Energy, Vertiv, Goldman Sachs, NVIDIA investor data. [13] DeNexus economics analysis.

FIGURE 12 — AI Data Center vs. Traditional DC — Full Cost Structure per MW ($M)

Implications for Lenders and Investors

The financial risk picture for capital providers breaks into three dimensions. First, the unmodeled tail risk: an OT loss event — extended facility outage, equipment damage, prolonged BI — lands on balance sheets that are already compressed. There is no financial cushion in the FCF dynamics of 2026–2027 to absorb an unplanned capital event of meaningful scale. Second, covenant exposure: the typical debt covenant package for infrastructure financing was not designed to contemplate OT-driven downtime scenarios. A prolonged outage triggering revenue shortfall could test debt service coverage ratios that looked comfortable on pro-forma. Third, collateral quality: the value of a data center as collateral is a function of its operating capability. An asset with unquantified, unmitigated OT risk is worth less than the underwriting models suggest — because the probability-weighted loss scenario is not in the model.

A fourth dimension is now emerging: lender concentration and structured risk transfer. Major banks — led by JPMorgan — are structuring single-borrower Synthetic Risk Transfers (SRTs) to offload concentrated data center construction loan exposure. The core problem: SRT tranche investors cannot model the tail risk because no one has quantified what happens when a half-built, single-borrower data center experiences a cyber-physical OT event during construction or commissioning. DataCenter Dynamics confirmed in May 2026 that lender due diligence frameworks do not model OT-driven outage scenarios that trigger SLA penalties — the same gap Marsh identified from the insurance side. The convergence is structural: insurance gap, lender gap, and regulatory gap all point to the same missing layer — OT risk quantification.

The SLA breach exposure reinforces this. Marsh's Kelly Butler and Derek Wischmeyer publicly stated in May 2026 that data center SLA breaches can trigger $5 million monthly penalties and near-billion-dollar termination exposure — and that a one-second outage can trigger a full month's rent credit. These contractual penalties are not modelled in standard lender credit analysis. Capital providers holding concentrated DC exposure — whether on the balance sheet or in SRT tranches — need the same OT loss quantification that insurers need to price coverage.[62]

The institutional signal is now unmistakable. In May 2026, BlackRock CEO Larry Fink — managing more than $10 trillion in assets — publicly framed compute capacity as a commodity-level asset class, placing AI data center infrastructure in the same investment category as power generation, pipelines, and ports. [63] The world's largest asset manager is directing pension funds and sovereign wealth funds toward compute infrastructure. The implication for this analysis is direct: traditional infrastructure LP due diligence standards — which include OT risk assessment, cyber risk quantification, and insurance adequacy verification — now apply to AI data center investments. As BlackRock-class institutional capital treats compute as infrastructure, OT risk quantification shifts from an optional operational add-on to a mandatory diligence requirement for every fund holding these assets.

The asset values themselves are straining the insurance and reinsurance markets. Zurich reported in 2026 that individual data center project values have surged from $150 million to $3 billion in five years — a 20× increase that is overwhelming traditional primary and reinsurance capacity. Zurich is now pushing expected maximum loss (EML) modeling over full-value coverage, a probabilistic approach aligned with scenario-based OT risk quantification. [64]

Severe weather has been the #1 loss cause in Zurich's US data center builders risk portfolio for three consecutive years — and 64% of 2026 DC construction is outside traditional hubs, in locations with less market familiarity and higher nat-cat exposure. [64]

The institutional capital continues to scale without OT diligence. KKR launched Helix Digital Infrastructure in June 2026 with $10 billion+ in committed capital, Adam Selipsky (former AWS CEO) as CEO, NVIDIA as a strategic partner, and Vistra (50,000 MW across 18 states) as preferred power provider. Helix operates as a single coordination point for compute, power, and connectivity — meaning an OT compromise at Helix cascades across every hyperscaler tenant simultaneously. [65] KKR's "Beyond the Bubble" investment thesis contains zero OT risk treatment. The world's most sophisticated PE firm is building the most integrated AI infrastructure platform in the market without quantifying the OT layer that controls every physical system in every facility. The Goldman ROI warning: $1 trillion in annual AI profit is needed to justify the current investment trajectory. Analyst consensus sits at $450 billion — a 2:1 gap. If AI revenue ramps slower than the infrastructure build, the assets holding the capital are worth less. OT risk events accelerate that scenario.

SECTION 06

Geographic Concentration — The Hubs

THROUGH YOUR LENS · DATA CENTER OPERATOR

If you operate in Northern Virginia, Texas, or Phoenix, this section is your neighborhood risk map — grid constraints, water limits, and the concentration that turns a local event into a shared one. 70% of global internet traffic passes through the NoVA corridor.

THROUGH YOUR LENS · PE INFRA INVESTOR

Concentration is a portfolio construction problem: 20.32 GW live in Loudoun County trending to 43.52 GW by 2031, with a risk level the paper rates EXTREME. Geographic exposure across your assets may be more correlated than your model assumes.

THROUGH YOUR LENS · LENDER

The Virginia GS-5 tariff — 85% minimum demand charges and 14-year minimum contract terms — creates "structured, long-duration financial exposure that lenders will need to model against OT risk scenarios over that same timeframe." Verbatim, and aimed at you.

THROUGH YOUR LENS · INSURER / REINSURER

A coordinated event across NoVA’s 20+ GW cluster is the accumulation scenario this section documents: "no current product or model addresses this." Swiss Re has flagged $10B single-site loss scenarios as credible.
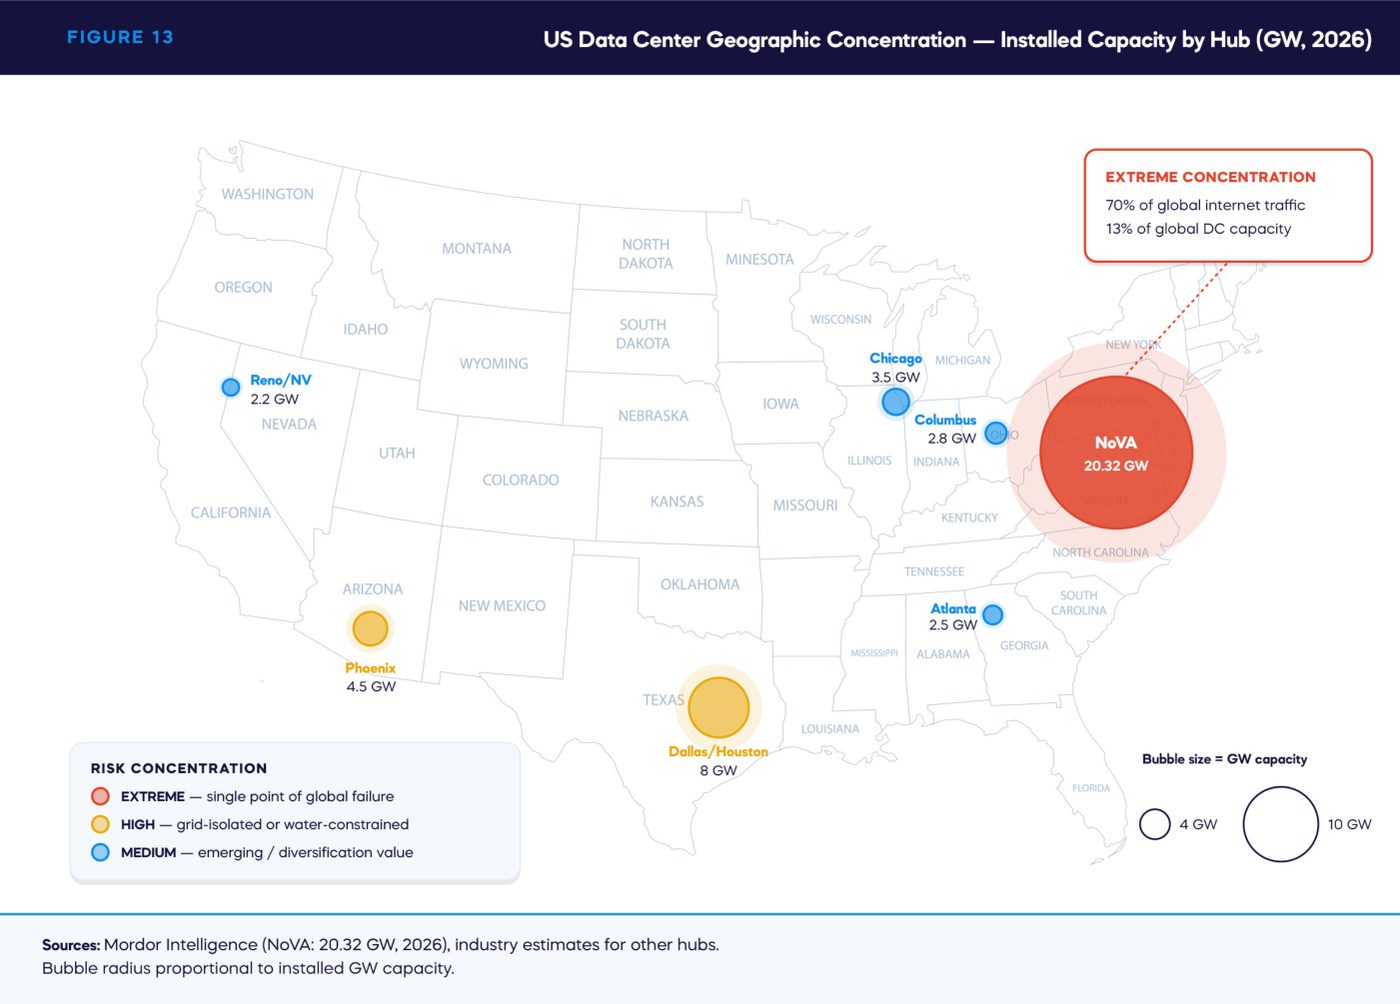
Why Geography Is a Risk Variable

AI data centers are not evenly distributed. They cluster — for historical reasons (fiber infrastructure, power availability, tax incentives), for operational reasons (proximity to existing cloud campuses and skilled labor), and for regulatory reasons (some states have been more welcoming than others). This clustering creates concentration risk that is qualitatively different from the asset-level risks discussed above. A disruption event in a high-concentration geography is not a single facility event. It is a systemic event.

FIGURE 13 — US Data Center Geographic Concentration — Installed Capacity by Hub (GW, 2026)
TABLE 9 — US Data Center Geographic Concentration — Primary Hubs (2026)
Hub / StateScaleKey FactsPower InfrastructureConcentration Risk Level
Northern Virginia
Loudoun County (Figure 14) — "Data Center Alley"
20.32 GW live (2026); 43.52 GW projected by 2031[41]199 operational DCs; 148 applications under review; 31M sq ft; 13% of global live DC capacity; 70% of global internet traffic passes through here; ~50% of Loudoun County tax revenue; $9.1B GDP contribution in VirginiaDominion Energy grid (undergoing 27 GW expansion by 2039); PJM $51B transmission remediation underway; grid connection wait: 4–7 years; BTM gas rapidly expanding[69]EXTREME — Single event here is a global internet event
Texas
Dallas / Houston / Austin corridor
Rapidly scaling — second largest US market by MWERCOT isolation (not connected to Eastern/Western Interconnects); SB 6 (2023) created large load framework; PUCT proceedings ongoing; BTM wave in Houston corridorERCOT grid — structurally isolated, historically vulnerable (February 2021 event); BTM generation expanding rapidly due to grid constraints; natural gas central to Texas energy mixHIGH — ERCOT isolation = no neighboring grid backstop
Phoenix (Arizona)Third-tier but rapidly growingAggressive tax incentives historically; Arizona water scarcity increasingly constraining growth; TSMC Arizona fab ($65B+ investment) creates AI supply chain proximityAPS and SRP utility territory; water scarcity = cooling constraint; increasingly BTM as utility capacity tightensMEDIUM-HIGH — Water is the limiting risk vector
Chicago (Illinois)Major colocation hub; growing hyperscale presenceCarrier-neutral internet exchange (CH1); Great Lakes water access; relatively lower power costs historicallyComEd utility territory; MISO interconnection; nuclear base load (Exelon fleet)MEDIUM — Diversification value vs NoVA concentration
Columbus (Ohio) / Atlanta (Georgia) / Reno (Nevada)Emerging hyperscale destinationsActive incentive programs; power availability; relatively lower land costs; growing as overflow from constrained primary marketsVaried utility territories; generally better grid availability than Virginia/Texas todayLOWER — But OT security posture often weaker in newer markets

Sources: Mordor Intelligence, Belfer [41][66][41] Center/Harvard (Virginia-Texas Case Study, April 2026), NERC 2025 LTRA, Data [69]Center Knowledge, MultiState. DeNexus market analysis.

Northern Virginia — The World's Highest-Stakes Digital Infrastructure Cluster
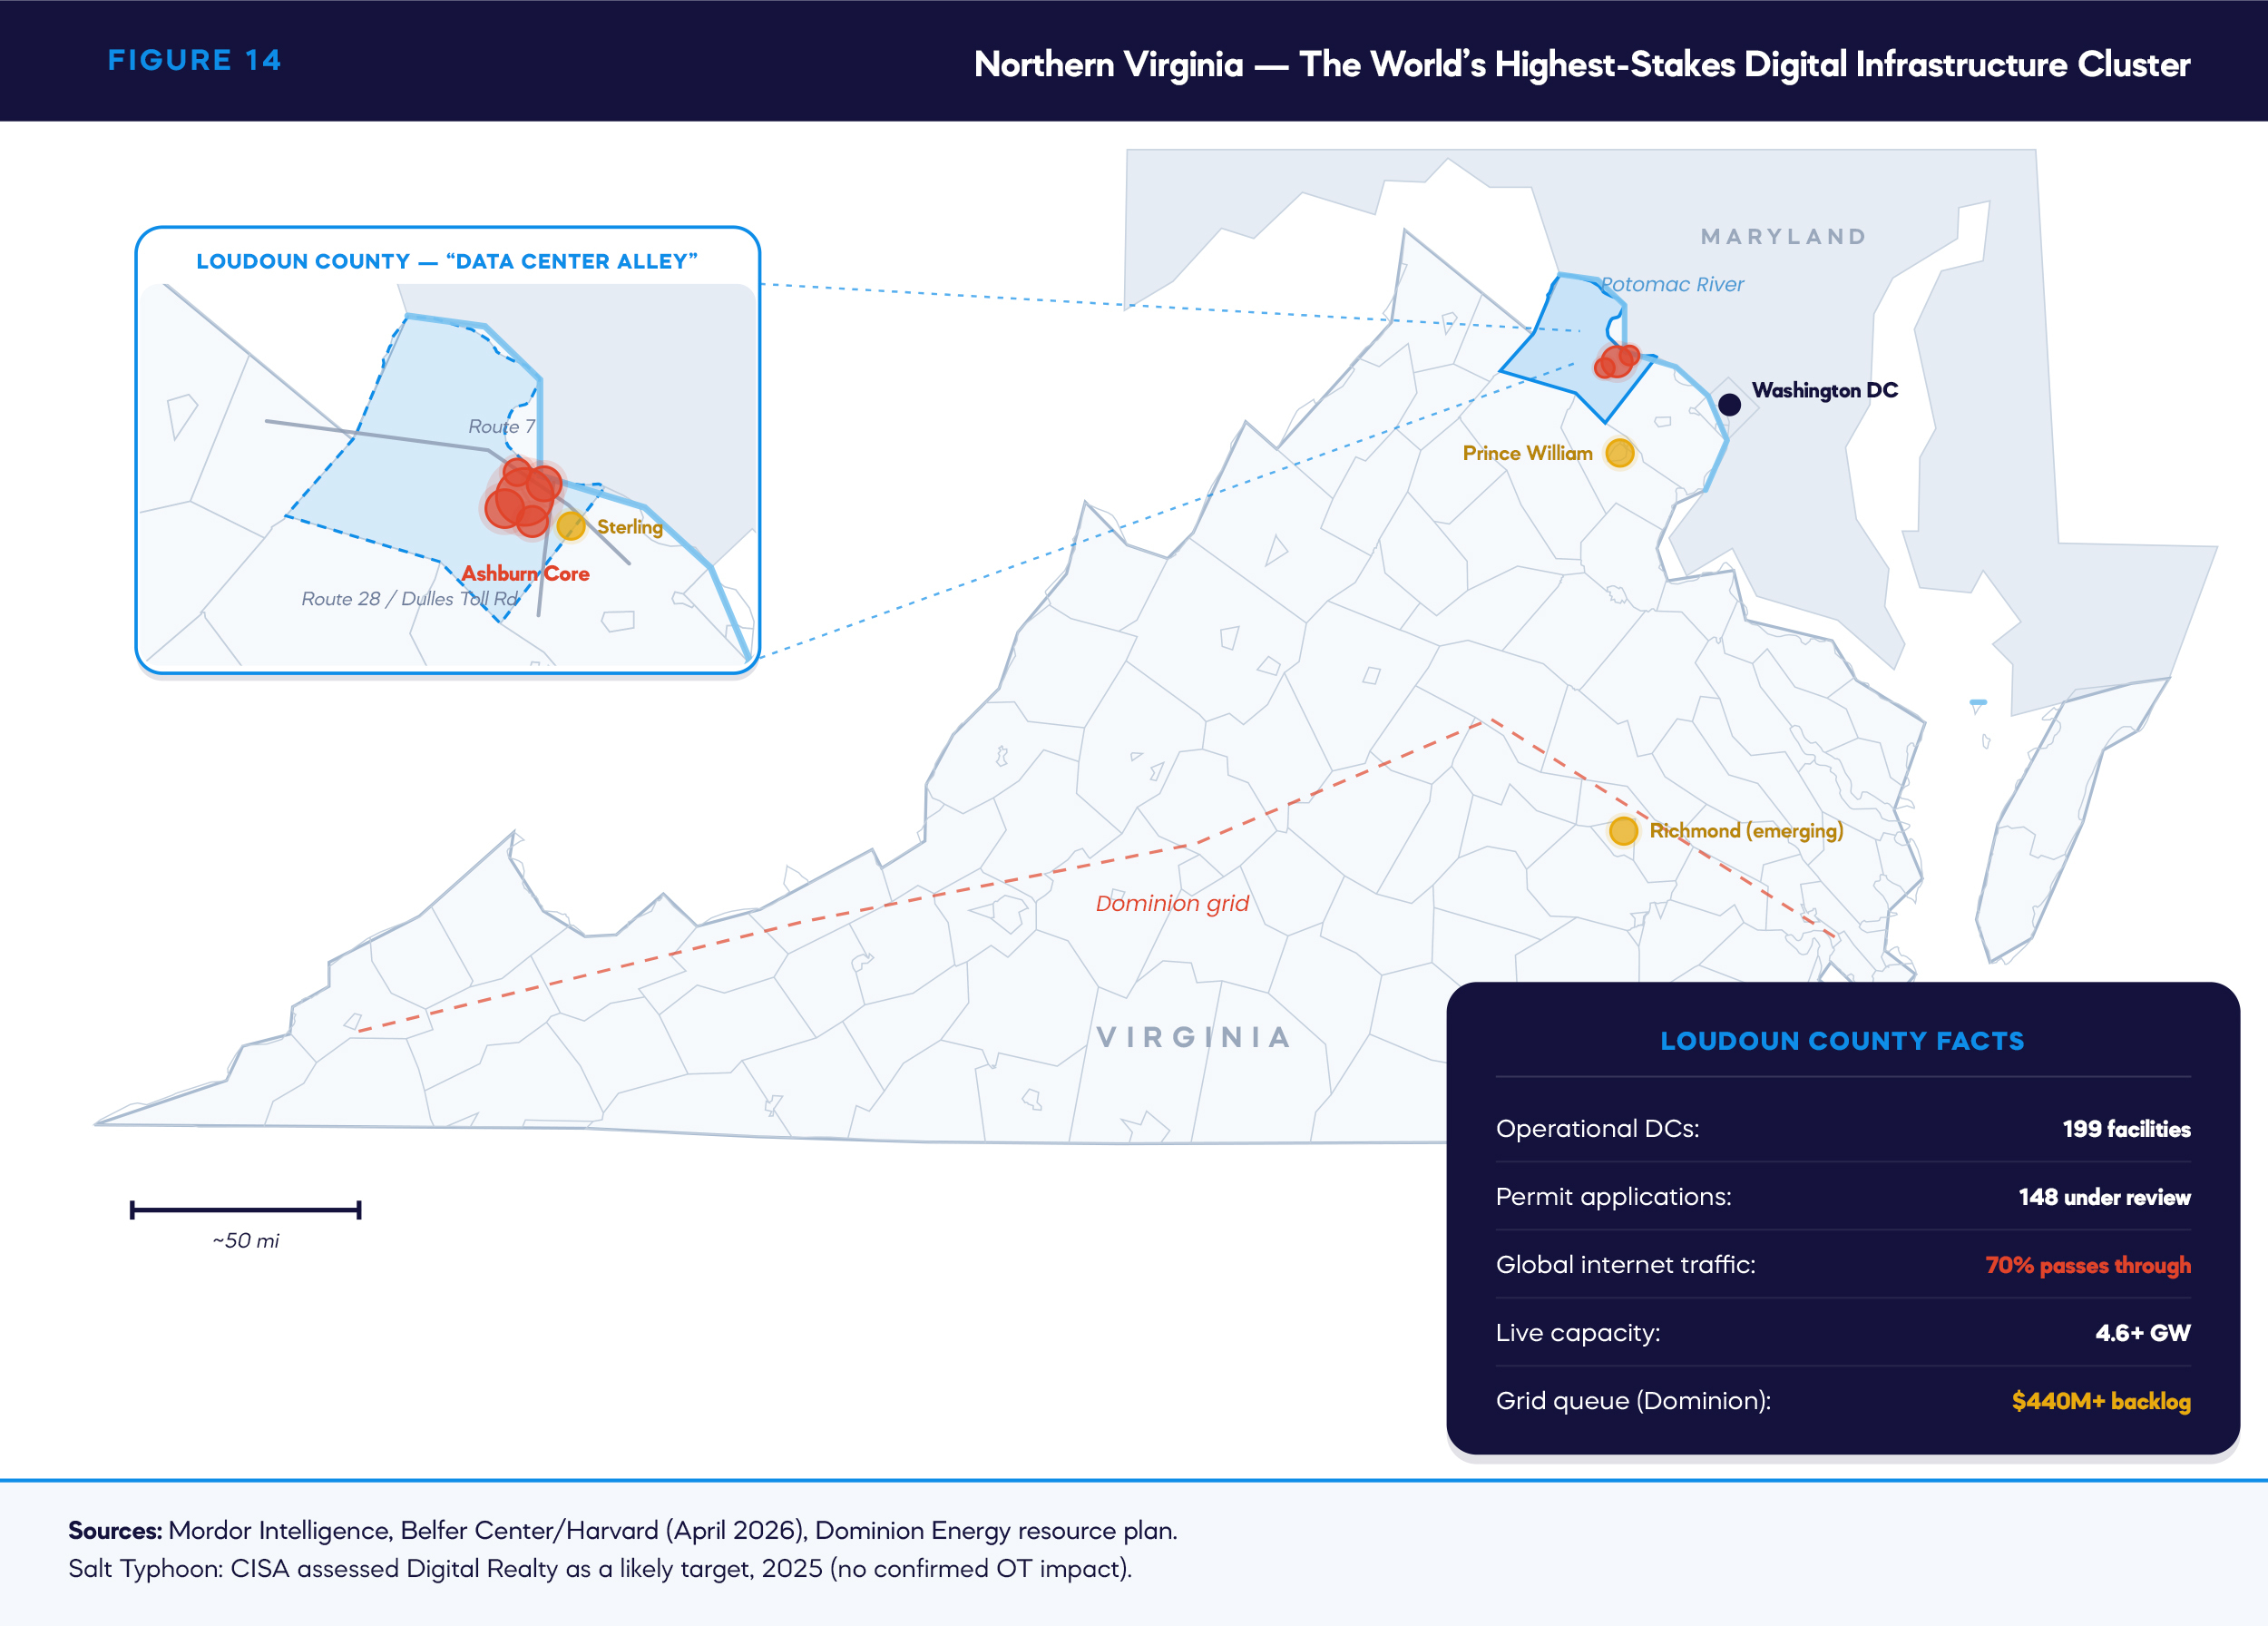
FIGURE 14 — Northern Virginia — The World's Highest-Stakes Digital Infrastructure Cluster

Loudoun County, Virginia is, by any reasonable measure, the most consequential concentration of digital infrastructure on the planet. Seventy percent of global internet traffic passes through this corridor (Figure 14). A disruption event here — whether from a physical attack, a grid event, or a coordinated OT cyber incident — is not a regional data center story. It is a global internet event.

The scale continues to grow. Twenty-point-three two gigawatts of live capacity in 2026, on a trajectory to 43.52 GW by 2031. One hundred forty-eight applications currently under review, even as Loudoun County ended by-right data center approvals in March 2025, requiring every new project to go through a public hearing. Digital Realty's Ashburn campus alone carries 632 MW of IT load capacity — and was the site of the its operator, Digital Realty, was assessed by CISA as a likely target of the Salt Typhoon telecom-espionage campaign in 2025 (no confirmed OT impact).[99]

The power infrastructure story in Northern Virginia is itself a risk factor. Dominion Energy has approved a first base-rate increase since 1992 and a 27 GW generation expansion plan by 2039. The PJM regional transmission organization has received 92 bids for transmission upgrades totaling $51 billion in remediation specifically related to Northern Virginia load growth. Grid interconnection is running 4–7 years — a timeline that is already outpacing construction. BTM generation is the gap-filler, and BTM OT attack surface is expanding proportionally. [69]

The Virginia GS-5 tariff (effective January 2027) — with 85% minimum demand charges for T&D and 14-year minimum contract terms — creates a regulatory structure that forces long planning horizons. It also creates structured, long-duration financial exposure that lenders and insurers will need to model against OT risk scenarios over that same timeframe.

The Regulatory Divergence Risk

The federal-state tension in AI data center policy is accelerating and creating a new risk dimension. FERC is fast-tracking interconnection and explicitly encouraging BTM generation deployment. States are responding with their own agendas. MultiState's April 2026 tracker documents 300+ data center-related bills across 30+ states in 2026, with an increasing number targeting moratoriums, energy cost allocation, and environmental conditions rather than incentives.

Twelve states have attempted statewide data center moratoriums. Eleven failed. Maine is advancing and is likely to become the first state29 to pass one. The implications extend beyond Maine: operators who built business cases around a permissive regulatory environment in a given state now face the possibility that environment changes mid-construction or mid-lease. The geographic risk arbitrage this creates — operators shifting to less-regulated states — has a direct OT security consequence. Less-regulated states typically have weaker OT security postures, less mature utility oversight, and fewer skilled OT security resources. Construction moving to permissive jurisdictions does not reduce OT risk; it concentrates it in environments less equipped to manage it.
Forward Commitment: State-Level Deep Dives

This analysis provides the national and hub-level framework. DeNexus will publish dedicated state-level intelligence briefs for Northern Virginia, Texas, Arizona, and additional emerging markets — with specific OT risk profiles, regulatory analysis, utility infrastructure assessment, and loss scenario modeling calibrated to each geography.

SECTION 07

The Insurance Gap

THROUGH YOUR LENS · DATA CENTER OPERATOR

The coverage you think you carry may not respond to the events this paper documents: BMS/OT compromise is "not covered by any current dedicated DC program," and BI terminates at 12 months against turbine replacement timelines of 5–7 years.

THROUGH YOUR LENS · PE INFRA INVESTOR

An 82–94% protection gap means the tail risk of your asset is, in effect, self-insured by the equity. The gap matrix in this section is the exhibit to bring to the next investment committee.

THROUGH YOUR LENS · LENDER

The BI duration mismatch is a credit event in waiting: coverage expires before the replacement asset arrives, for every major equipment class. What bridges the borrower between month 12 and year 5 is your problem.

THROUGH YOUR LENS · INSURER / REINSURER

$20B of demand per single risk against $2.7–3.5B of supply — a 17.5% fill rate. The section’s finding: "The gap is not a capital problem... The binding constraint is the absence of quantification infrastructure."
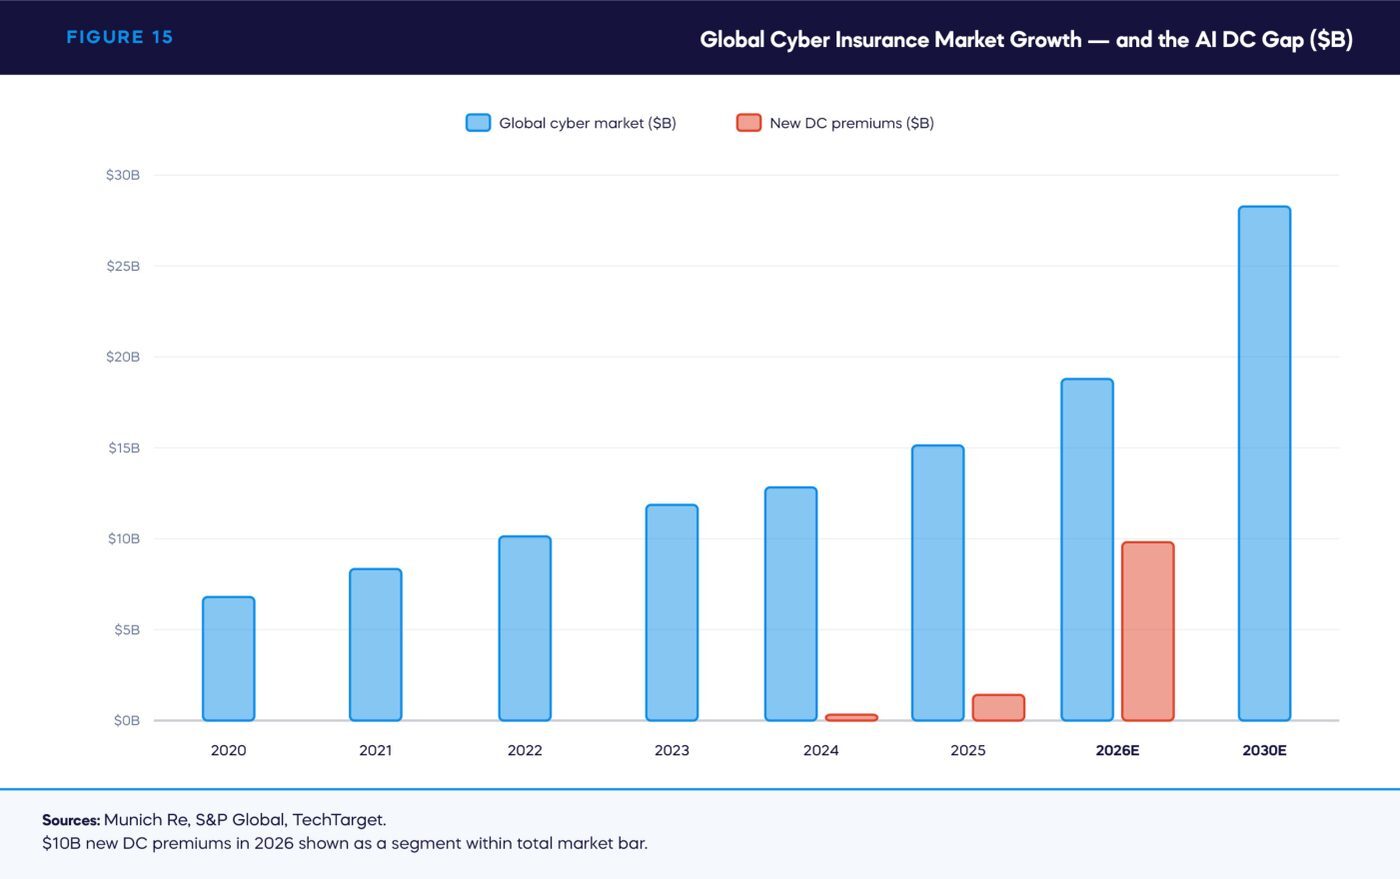
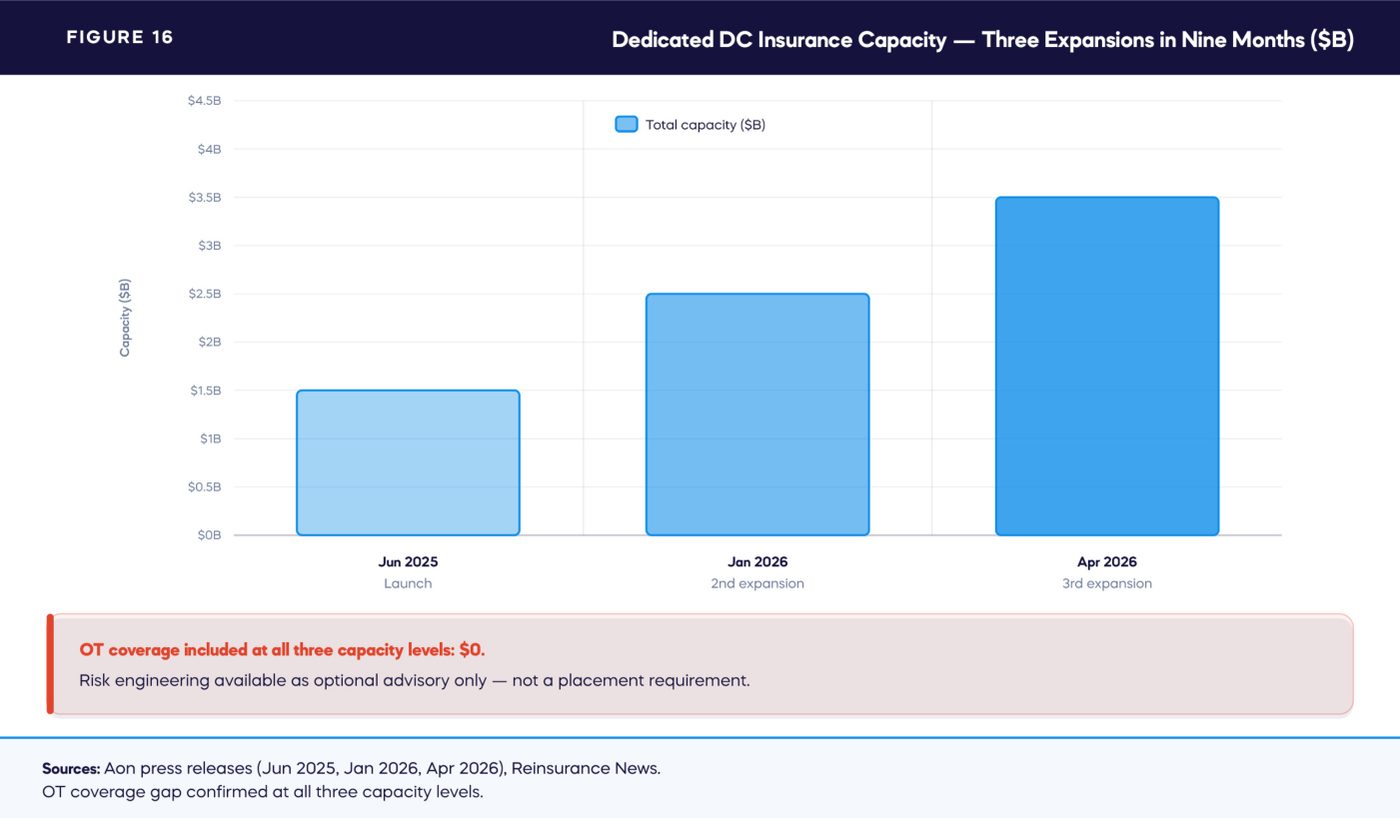
The Market Is Moving — But Into the Wrong Risk Layer

The insurance and reinsurance market has moved with genuine velocity in response to the AI data center buildout. Four dedicated programs launched or significantly expanded between June 2025 and April 2026: Aon's Data Center Lifecycle Program (DCLP) expanded three times (Figure 16) in nine months, reaching $3.5 billion in April 2026. [6] Marsh launched Nimbus at $2.7 billion. Willis operates a $3 billion+ hyperscale program. The ATA Lloyd's consortium — Arch, Munich Re Specialty, and Scor — added $750 million in capacity. S&P projects $10 billion in new data center insurance premiums in 2026 alone, against a global cyber market of $15.3 billion in 2025 projected to reach $28–30 billion [8] (Figure 15) by 2030. [6][7][8]

The capacity is real. The problem is structural: every one of these programs addresses the IT and property layers. None of them has resolved the OT layer. The gap between what the market has built and what the actual risk profile demands is not a gap in appetite — it is a gap in data. And the OT cyber risk that drives the most consequential loss scenarios is precisely the layer that remains unquantified, unmodeled, and therefore unpriced.

$10B
New data center insurance premiums projected in 2026 — fastest-growing segment in commercial insurance (S&P Global)
$28–30B
Global cyber insurance market projected by 2030 — up from $15.3B in 2025. AI data centers are the primary growth driver (Munich Re / S&P)
9/10
C-level executives say their company is inadequately protected against cyber attacks — Munich Re Cyber Risk Survey 2026
20%+
Premium decreases for organizations with layered security controls, plus enhanced coverage terms (Risk Strategies, 2025). Quantification is how operators demonstrate that posture.[80]
FIGURE 15 — Global Cyber Insurance Market Growth — and the AI DC Gap ($B)
FIGURE 16 — Dedicated DC Insurance Capacity — Three Expansions in Nine Months ($B)

A Critical Clarification: Munich Re aiSure™ Is Not an OT Product

Munich Re's aiSure™ has been widely cited as evidence that the insurance market is responding to AI data center risk. It deserves a precise description, because the distinction matters for this audience. aiSure covers AI performance failures — errors, hallucinations, model drift, unexpected deviation in AI output — using a parametric-like trigger structure. It was developed in collaboration with Mosaic Insurance and launched in February 2026 with initial capacity of $15 million, targeted at AI developers and vendors. [72]

aiSure is not an OT cyber product. It does not cover BTM gas turbine DCS compromise. It does not cover BMS exploitation causing thermal events. It does not cover physical damage caused by a cyber attack on a data center's power infrastructure. Munich Re separately acknowledges physical damage following cyber events as a common coverage gap — and has indicated intent to address it — but that product does not yet exist in structured, deployable form for the AI data center market. The gap is confirmed, not closed.

What aiSure does demonstrate, however, is the principle that quantification enables insurability. aiSure requires defined, measurable AI performance benchmarks as the parametric trigger. The same logic applies to OT cyber risk: once exposure is quantified and monitored, coverage becomes structurable. The model is proven. The application to OT remains to be built.

The Confirmed Gaps in Current Programs

A detailed review of the four major dedicated programs reveals the same structural gap in each. Aon DCLP's cyber layer covers $400 million of IT-layer cyber BI and ransomware protection. It contains no explicit BTM gas turbine OT coverage, no OT-specific policy language, and — critically — does not require OT quantification as a placement condition. Risk engineering and cyber impact modeling are available through Aon's advisory team, but optional. [6] Marsh Nimbus, Willis, and ATA follow similar patterns. The programs are well-designed for the risk they were built to cover. OT cyber risk for industrial-class infrastructure was not that risk.[62]

Marsh — May 21, 2026: The SLA Gap No Product Addresses

Marsh's Kelly Butler and Derek Wischmeyer publicly quantified the SLA breach exposure: a one-second outage can trigger a full month's rent credit. Sustained breaches can trigger $5 million monthly penalties and near-billion-dollar termination exposure. No current insurance product fully addresses this. Marsh named parametric cyber solutions as the emerging product form for SLA gap coverage — confirming that the market has willingness to cover but lacks the ability to price. The root cause of most outages is OT: power (45–54%) and cooling (19%) per Uptime Institute 2026. Insurance is pricing these contracts without quantified OT risk.[36] The most telling signal comes from the top. Berkshire Hathaway's Ajit Jain — the most respected underwriting mind in global reinsurance — publicly stated in 2026 that Berkshire cannot answer the question "how bad can bad be?" on cyber aggregation risk. Without that answer, the world's most sophisticated insurance capital is sitting out hyperscale data center coverage entirely. [73] Jain expects Berkshire to be active in AI DC insurance "sometime in the next few years" — but only after quantification infrastructure exists to price the risk. The implication is structural: fund managers and DC operators holding these assets right now are sitting on risk that even Berkshire won't touch. That is not a future problem. It is a current uninsured exposure.

The technical mechanism behind this gap became visible in early 2026 when the AWS drone strikes in the UAE and Bahrain triggered a Lloyd's Market Association review of war exclusion clauses. The analysis revealed that a kinetic-to-cyber-to-OT loss sequence creates five simultaneous coverage voids: (1) the cyber war exclusion (LMA5564A–5567A) blocks the cyber leg, (2) property cloud BI exclusions block the infrastructure leg, (3) hyperscaler force majeure clauses block the contractual leg, (4) reinsurance back-to-back war exclusions block the capacity leg, and (5) geographic carve-backs exclude Gulf/Middle East attacks entirely. [74] Without a documented OT baseline — a pre-event inventory of what systems exist, what their vulnerability posture is, and what the financial consequence of compromise would be — neither the insured nor the insurer can distinguish a war-excluded OT loss from a covered one. The five voids are not five separate problems. They are one problem — the absence of OT quantification — expressed five ways across different policy layers.

The opposite architectural extreme creates an equally acute insurance problem. Microsoft's Fairwater campus in Atlanta operates with zero backup generators, zero UPS, and zero behind-the-meter generation — a grid-only model Microsoft pitches as "4×9 availability at 3×9 cost." By eliminating all backup power OT, Fairwater removes the Pillar 1 attack surface entirely. But it creates 100% grid dependency with zero graceful degradation: a grid OT compromise — or even a grid frequency event like the Virginia 9-DC incident documented in Section 2.4 — means immediate total outage. No managed failover, no ride-through, no time buffer. The Marsh $5 million monthly SLA penalty scenario activates instantly. Of the six AI DC campuses analysed in the Measured AI study, Fairwater has the most acute SLA breach exposure — precisely because it traded OT complexity for grid dependency, and the grid's OT is outside the operator's control.[32]

The world's largest reinsurer confirms the structural void. Munich Re launched a dedicated data center risk landing page in 2026 framing the market at $6–7 trillion by 2030, with single campus total insured values reaching $20 billion and 33% of facilities expected to operate on on-site generation by 2030. [75] Severe storm losses in 2025 reached $50 billion. Munich Re's analysis covers fire, natural catastrophe, construction, and business interruption — but contains zero mention of HVAC OT, cooling controllers, BMS, power management systems, or any OT cyber risk. The world's most sophisticated reinsurer has built a data center risk program without addressing the control layer that causes the majority of outages.

TABLE 10 — Insurance Coverage Gap Matrix — AI Data Center Risk Layers (Updated May 2026)
Risk LayerWhat Current Programs CoverConfirmed GapRoot CauseMarket Status
IT Cyber RiskData breach, ransomware (IT-only), network interruption, third-party liability. Aon DCLP: up to $400M cyber/Tech E&O including non-damage DSU and ransomware.[6]Physical damage caused by cyber event; IT/OT convergence events; anything crossing into the physical-cyber boundaryPolicies written for IT infrastructure before IT/OT convergence was a design consideration. Physical-cyber boundary undefined in most policy language.Partial — Boundary disputes active at claims stage
OT / Building Systems (BMS/DCIM)Not covered by any current dedicated DC program. Some bespoke placements with explicit endorsements — rare and expensive.BMS compromise → thermal event, fire suppression discharge, EPO activation. DCIM attack → full facility shutdown. Physical damage from cyber-caused OT failure. Confirmed: Aon DCLP has no OT policy language.OT not historically modeled in cyber insurance. Property policies contain standard cyber exclusions. Physical-cyber sits between both markets and falls through both.Critical Gap — Billions uninsured; highest probability attack path
BTM Power Generation OTConstruction all-risk covers physical damage (not OT cyber). Operational property covers fire/flood. No policy form exists for BTM OT cyber as a distinct risk class.OT cyber attack on gas turbine DCS causing forced outage or equipment damage. BTM OT during construction entirely uncovered by standard all-risks. No standalone policy form — the risk is currently uninsurable by structure.BTM gas turbine OT is a new asset class for insurers. No actuarial loss history. No security baseline requirements to assess. Underwriters cannot price what they cannot model.Uninsurable — No policy form; no actuarial data; no placement path
Business Interruption — Duration MismatchStandard BI: 12-month maximum; 30-day waiting period standard. Cyber DSU available in DCLP at $400M limit — but IT-layer trigger only.Gas turbine replacement: 5–7 year lead time. Power transformer replacement: 2–4 years. GPU replacement: 36–52 weeks. In each case, BI coverage expires before the replacement asset arrives. The mismatch is structural.BI policy terms were set for IT recovery timescales (days to weeks), not industrial equipment replacement cycles (months to years). No product has yet been structured around actual asset replacement lead times.Structural Gap — BI cover terminates before recovery is complete
Nation-State / War ExclusionCoverage exists — until the war exclusion activates. All four major programs carry war/nation-state exclusions that void coverage for attacks attributed to sovereign actors.Volt Typhoon, Salt Typhoon pre-positioning confirmed. AWS drone strikes triggered broad war exclusion review across Lloyd's and company markets. Exclusion stacking: war + nation-state + infrastructure exclusions create compounding voids. Attribution challenge: criminal/state boundaries deliberately blurred.Lloyd's mandated nation-state exclusions from 2023. Carriers are inconsistently applying thresholds. Attribution is forensically contested at exactly the moment when a claim is presented.Escalating — Primary exposure for Typhoon-class scenarios is currently uninsured
Concentration / Systemic RiskIndividual facility coverage available across all programs. No multi-facility or systemic event coverage exists.A coordinated event across NoVA's 20+ GW cluster. Cloud workload aggregation across hyperscaler platforms. Swiss Re $10B single-site loss scenario. Correlated loss from a shared OT vendor compromise (Schneider Electric: 3 breaches in 18 months).[23][8]Aggregation modeling for AI DC systemic events has not been developed. Accumulation risk across concentration hubs is not priced. Correlated OT vendor exposure is not modeled.Market-Level Risk — No current product or model addresses this

Sources: Aon DCLP program documentation (April 2026), Marsh Nimbus, WTW, Munich Re aiSure architecture[62][6], Baldwin Group/The Insurer (March 2026), S&P Global, Swiss Re, Morgan Lewis, Hotaling Insurance (2026), DeNexus insurance market analysis[90].

The Lifecycle and Broker Reality

The Baldwin Group's lifecycle analysis — confirmed by The Insurer in March 2026 — identifies the commissioning phase as the highest-risk point (Figure 17) in any data center's life: IT/OT integration underway, systems poorly configured, access controls not yet hardened. Standard all-risk property policies cover construction. Cyber policies cover operations. The transition falls between them. AI compute density and lithium-ion battery fire risk add physical hazards that underwriters acknowledge they are struggling to model, given the absence of loss history at hyperscale.

FIGURE 17 — Coverage Across the Data Center Development Lifecycle — Where the Gaps Fall

Brokers are responding by building bespoke coverage towers — coordinating property, cyber, construction, marine, and energy specialists in single placements. Hotaling Insurance's 2026 analysis of what leading brokers are doing differently captures the structural challenge precisely: GPUs qualify as "electronic equipment" requiring specialized inland marine; transformer and turbine replacement timelines of 2–7 years are irreconcilable with 30-day BI waiting periods; war exclusion language triggered by kinetic strikes on AWS infrastructure has prompted comprehensive policy review across every major market. [90] These are not edge cases. They are the central structural challenges of the AI DC insurance market in 2026.

Three Emerging Product Opportunities — and What They Require

The insurance market's product development frontier has identified three specific innovations that could materially close the gap. Each one requires OT quantification as a prerequisite.

Parametric OT coverage triggers. WTW and Resilience Cyber are both exploring parametric products — coverage triggered by objective operational parameters (voltage deviation events, downtime duration thresholds) rather than forensic attribution of cause. This structure specifically bypasses the war exclusion attribution problem: if the trigger is a measurable physical event, attribution to a specific actor becomes irrelevant to coverage. No current parametric product uses OT sensor data as the trigger mechanism. DeNexus CRQ monitoring data could serve as both the risk baseline and the triggering data stream — this is the most commercially promising product design opportunity in the current market.

Replacement-timeline-calibrated BI. Gas turbine lead times run 5–7 years (Figure 18). Power transformer lead times run 2–4 years (Figure 18). GPU lead times run 36–52 weeks. Standard BI coverage periods of 12 months are structurally mismatched to the actual recovery timeline for any of these asset classes. A BI product calibrated to actual asset replacement lead times — structured around specific hardware inventory and confirmed manufacturer delivery schedules — would eliminate the most significant practical gap between what is insured and what is actually at risk. OT quantification per site, specifying asset inventory and lead times, provides the data foundation for this structure.

The GPU layer compounds the mismatch. At Jensen Huang's confirmed pricing, a 1 GW AI campus holds $35 billion in NVIDIA GPU hardware — H100, H200, and Blackwell-class accelerators with lead times of 36–52 weeks for replacement orders. Standard business interruption coverage periods cap at 12 months. If a cyber-physical OT event (thermal cascade, UPS failure, BMS compromise) destroys a significant portion of the GPU cluster, the operator faces a replacement timeline that may exceed BI coverage by 6–12 months — during which revenue loss continues but insurance has stopped paying. No current BI product structures coverage around actual GPU replacement lead times. OT quantification can specify the GPU inventory, thermal exposure, and replacement timeline per site — enabling parametric or extended-indemnity coverage calibrated to the real recovery period rather than an arbitrary 12-month cap.[60]

BTM OT as a standalone risk class. No standalone policy form yet exists for BTM gas turbine OT cyber risk. The asset class sits in the gap between property insurance (physical damage, not cyber-physical), cyber insurance (IT/OT but excluding heavy industrial equipment), and energy insurance (generating assets, but not DC-adjacent configurations). Establishing a policy form requires actuarial data — loss models, exposure baselines, and security posture assessments. OT cyber risk quantification across the BTM generation fleet is the data prerequisite for any underwriter willing to write the first policy.

The market signal: insurers are already rewarding demonstrated security posture with concrete premium discounts — Risk Strategies reports organizations with layered cybersecurity controls seeing premium decreases in excess of 20%, plus enhanced coverage terms. OT risk quantification is how an operator demonstrates that posture at placement — not in theory, but in practice, at placement. The financial case for OT quantification is not only about closing coverage gaps. It is about the cost of the coverage that already exists.[80]

FIGURE 18 — The BI Duration Mismatch — Coverage Ends Before Recovery Begins (Months)
SECTION 08

Solutions and Mitigation Framework

THROUGH YOUR LENS · DATA CENTER OPERATOR

The mitigation framework starts at your layer: OT visibility, segmentation of shared infrastructure, and site-level quantification that turns your security posture into evidence insurers and lenders can act on.

THROUGH YOUR LENS · PE INFRA INVESTOR

Three questions with evidence — OT-driven loss exposure, mitigation impact, and residual transferability — define what "OT diligence" should mean before the next term sheet.

THROUGH YOUR LENS · LENDER

The framework gives debt providers a concrete underwriting condition: quantified OT loss exposure per site, expected and tail, before capital is committed — the same standard the central recommendation applies to all three capital roles.

THROUGH YOUR LENS · INSURER / REINSURER

Parametric OT triggers and replacement-timeline-calibrated BI are the two product designs the section identifies — and both "require OT quantification as a prerequisite." That is the build order for closing the gap profitably.

Visibility First — The Non-Negotiable Prerequisite

Every meaningful mitigation action in OT cyber risk starts with visibility. You cannot defend what you cannot see. You cannot insure what you cannot quantify. You cannot report to a board, a lender, or an LP what you have not measured. The less than 10% monitoring coverage figure cited throughout this analysis is not a criticism of operators — it reflects the absence of appropriate tools, standards, and requirements. Closing that gap is the first step in every rational risk management program.

OT visibility is not IT monitoring applied to OT. It requires four distinct capabilities:

01

Asset Inventory

Knowing what OT systems are on the network — every PLC, BMS controller, DCIM endpoint, EPMS, and SCADA node — including those connected via vendor remote access.

02

Vulnerability Posture

Current vulnerability status of each device — KEV exposure, firmware version, patch state, known exploit availability — mapped against the CISA KEV catalog and ICS-CERT advisories.

03

Behavioral Baseline

Network traffic patterns distinguishing normal OT operations from anomalous behaviour — protocol-aware monitoring for Modbus, DNP3, BACnet, and IEC 61850, not just IP-layer inspection.

04

Financial Consequence

The quantified financial impact of a compromise event for each OT system — expected annual loss, tail loss, BI duration, hardware replacement cost — in the language that boards, lenders, and insurers require.

The protocols, the operating constraints, and the consequence models are fundamentally different from IT. Each of these four capabilities requires purpose-built OT tooling — not IT security tools repurposed for OT environments.

From Visibility to Quantification

Visibility enables monitoring. Quantification enables decisions. The distinction matters because the audiences for this analysis — investors, lenders, insurers — do not operate in vulnerability scores and technical severity ratings. They operate in financial exposure, expected loss, value-at-risk, and capital allocation. OT cyber risk quantification translates the technical reality of OT exposure into the financial language that capital markets require.

At DeNexus, this is the work of DeRISK CRQ — deployed in more than 300 industrial environments across power, manufacturing, and data centers. What we find consistently: the OT cyber risk in industrial environments is real, it is quantifiable, and it is substantially larger than the operators’ intuitive estimates before quantification. The average gap between perceived and quantified exposure is significant enough that it changes investment committee decisions, insurance placement strategies, and board-level risk appetite discussions.

Three independent market signals confirm the commercial mechanism. Gallagher's 2026 insurance market outlook identifies OT/ICS cyber risk as the fastest-growing segment in commercial insurance and names OT quantification as the specific instrument that enables placement — without it, insurers decline; with it, capacity unlocks and insurers reward the demonstrated posture with materially lower premiums (20%+ for strong controls; Risk Strategies, 2025[80]). Munich Re's stated underwriting philosophy is to "understand, assess, quantify and make cyber risks insurable"[7] — an exact description of the DeNexus CRQ process. Academic research (Arxiv, 2025) using graph-based modeling of cyber-attack propagation through BTM infrastructure confirms the technical foundation: BTM assets suffer more severe and longer-duration outages from cyber compromise than grid-connected generation because cascade paths are more direct and redundancy assumptions are false. The quantification methodology is proven. The insurance appetite is confirmed. The regulatory gap is documented in NERC's own language. The missing instrument is the OT risk quantification baseline that connects all three.[81]

Architecture and Operational Controls

The architectural principles for OT security in AI data center environments are well-established. IEC 62443 provides the international standard for industrial control system security — network segmentation, zone and conduit architecture, remote access controls, and patch management adapted to OT operational constraints. The challenge in AI data centers is not the absence of a framework — it is the speed of deployment outpacing the application of that framework.

Three specific controls deserve priority attention in the current environment. First, DCIM access control — the bridge between IT and OT must have enforced authentication, session recording, and anomaly detection. Second, BTM generation remote access governance — vendor VPN access to gas turbine DCS must be time-limited, monitored, and subject to minimum privilege principles. Third, BMS network isolation — HVAC, fire suppression, and power management OT must be segmented from corporate IT networks even when management systems are shared.

Regulatory Direction — and the Gap That Remains

The BTM OT regulatory vacuum is structural. FERC Chairman Laura Swett's January 2026 "Energized for 2026" priority statement names OT cybersecurity "at the operational level" as "job #1" while simultaneously fast-tracking 50 GW of generation through expedited interconnection[82] — much of it BTM. The regulatory mechanism creating the problem and the stated intention to address it are running in parallel, at different speeds, in different agencies.

The NERC 2025 Long-Term Reliability Assessment contains an extraordinary statement that belongs in every risk analysis of this sector: "Reliability impacts related to cyber and physical security risks are not specifically addressed in this assessment." The document covering the most consequential grid reliability stress in US history explicitly sets aside the cyber risk dimension. The NERC CIP Roadmap 2026, separately, acknowledges that "the framework is a "the framework is a qualitative model at its core"." NERC itself identifies the gap that OT quantification fills.

NERC's own 2026 State of Reliability report[35], uses language that inadvertently describes the OT cyber attack scenario without recognising it as such. The report characterises the emerging grid risk as "correlated and system-wide stresses" — the precise pattern that a coordinated OT cyber attack on data center infrastructure would produce. Multiple facilities experiencing simultaneous forced outages, cascading across interconnected systems, with protection systems responding in ways that amplify rather than contain the disturbance. NERC documents the pattern. NERC tracks the MW losses. NERC creates new registration categories to manage the grid reliability dimension. But the 2026 SOR contains zero OT cybersecurity analysis, zero mention of cyber as a potential cause or amplifier of the "correlated stresses" it documents, and zero requirements for OT security at the facilities producing these disturbances. The regulator is describing the attack surface without seeing the attacker.

The regulatory fragmentation accelerated on July 14, 2026, when New York became the first US state to enact a statewide data center moratorium. Governor Hochul signed Executive Order No. 62, imposing a one-year halt on state environmental permits for hyperscale data centers with peak demand of 50 MW or more. (A broader legislative measure, the Responsible Data Center Development Act at a 20 MW threshold, passed both houses of the state legislature in June 2026 but was not signed.) The state's grid operator (NYISO) reported its large-load interconnection queue grew from 6 projects and 1,045 MW in 2022 to 48 proposals totaling 12 GW by December 2025. More than 300 data center bills have been filed across 30+ states in 2026. [43] Over 100 local moratoria have been adopted nationwide. An estimated $64 billion in projects have been blocked or delayed. PJM's CEO David Mills stated publicly that the "current situation is not tenable" and declined to recommend a fix, kicking the problem to FERC and the states. The federal government is accelerating AI DC deployment while states are simultaneously restricting it. The result is a regulatory patchwork where OT cybersecurity requirements exist nowhere — not in the states that welcome data centers (which impose no OT standards) and not in the states that restrict them (which focus on energy, water, and environmental concerns, not cyber). [82][43][83]

Two specific regulatory developments in 2026 represent genuine progress — and illustrate the limits of that progress. First, the NERC Accelerated Large Load Action Plan (filed with FERC, Docket RM26-4-000, March 20, 2026): a new Standard Authorization Request for a Computational Load Reliability Standard was approved March 18, 2026, with revised standards due December 31, 2026 and a Level 3 Alert planned for early May 2026. This is the most direct regulatory response to date to the data center reliability challenge. It does not address OT cybersecurity for BTM generation. Second, CIP-015-1 (Internal Network Security Monitoring, INSM): now mandatory for high and medium impact BES assets — the first time network monitoring is a NERC mandate. BTM generation at AI data centers is explicitly excluded.

The pattern is consistent: regulation is moving toward the grid layer but not reaching the facility OT layer. Every FERC decision that accelerates AI data center infrastructure simultaneously expands the universe of BTM OT assets with zero NERC CIP coverage. This is not a temporary gap pending imminent regulation. It is structural — permanent unless NERC CIP scope is formally extended to customer-owned BTM generation. The voluntary OT security baseline, not the mandatory one, is the current state of the art for the most consequential industrial infrastructure in the US digital economy.

Regulation is otherwise moving, but it is moving more slowly than the buildout. NERC CIP (Critical Infrastructure Protection) standards apply to the Bulk Electric System — but the majority of BTM data center generation falls below the threshold that triggers CIP obligations. [81] FERC Order 1920 addresses transmission planning at a systemic level but does not reach into the facility OT layer. State PUC proceedings in Virginia (GS-5), Texas (PUCT/SB 6), and Pennsylvania (large load tariff framework) are advancing the regulatory framework for large loads — but none yet mandates OT security standards as a condition of service.[82]

The MultiState tracker shows 300+ data center-related bills in 30+ states in 2026. Most are focused on energy cost allocation, tax incentives, and environmental standards. OT cybersecurity requirements are emerging as a theme — but not yet as enacted law. The window between the current absence of OT security mandates and their eventual arrival is the period in which voluntary action has the greatest competitive advantage: operators who establish OT security and quantification programs now will be ahead of the regulatory curve when it arrives.

The Investor and Lender Checklist

For capital providers deploying into this sector, we offer a practical three-question checklist. These are the questions that any institution deploying capital into AI data center assets should be able to answer — with evidence, not assertion — before closing.

Question 1

What is the OT-driven loss exposure for this asset or portfolio — both expected annual loss and tail (99th percentile) loss — expressed in dollars?

Question 2

What specific mitigations are in place, what is the quantified risk reduction from those mitigations, and what residual exposure remains after their application?

Question 3

Of the residual exposure, what is credibly transferable to an insurance or parametric product, and what is the retained risk that must be provisioned for on the balance sheet?

Today, very few organizations deploying capital into AI data center infrastructure can answer all three questions with documented, quantified evidence. Building that capability — before the first significant OT event in a major concentration hub makes it a post-loss exercise — is the central recommendation of this analysis.

GLOSSARY

Glossary — Key Terms and Definitions

BES (Bulk Electric System)

The interconnected electrical transmission network in North America. NERC CIP security standards apply to assets that are part of the BES. Many BTM data center generation assets fall below the BES threshold, creating a regulatory gap.

BI (Business Interruption)

Insurance coverage for lost revenue and continuing fixed costs during a period when a facility cannot operate. Standard BI policies are often inadequate for AI data center interdependency scenarios.

BMS (Building Management System)

The OT platform that controls and monitors HVAC, fire suppression, access control, lighting, and power management in a facility. The primary documented entry vector for OT attacks in data centers. 75% of BMS devices carry Known Exploitable Vulnerabilities.

BTM (Behind-the-Meter)

On-site power generation that does not flow through the utility grid meter — gas turbines, diesel generators, battery storage, and fuel cells installed by data center operators to supplement or replace grid power. The primary source of new OT attack surface in AI data centers.

CISA

Cybersecurity and Infrastructure Security Agency — US federal agency responsible for critical infrastructure cybersecurity. Publishes the KEV (Known Exploited Vulnerabilities) catalog and ICS-CERT advisories.

CRQ (Cyber Risk Quantification)

The discipline of translating cyber risk exposure into financial terms — expected annual loss, value-at-risk, tail loss — that can be used for insurance placement, investment decisions, and board reporting. DeNexus DeRISK CRQ is the OT-specific implementation.

DCS (Distributed Control System)

An OT system used for real-time control of complex industrial processes — gas turbines, cooling systems, power distribution. The primary control layer for BTM generation in data centers.

DCIM (Data Center Infrastructure Management)

Software platform for managing and monitoring data center IT and physical infrastructure. Sits at the IT/OT boundary — if compromised, provides access to both network systems and physical infrastructure controls.

DCI (Data Center Interconnect)

High-capacity fiber optic links connecting data centers to each other and to the internet backbone. Carries both data traffic and operational management signals.

DSU (Delay in Start-Up)

Insurance coverage for revenue loss during construction delays. Part of the standard construction insurance package for data centers — but does not cover OT cyber risk during commissioning.

EPO (Emergency Power-Off)

A safety system that immediately cuts power to all IT equipment in a data center zone. Physical access to EPO controls, or compromise of EPO-connected OT systems, can cause immediate and total facility shutdown.

ERCOT

Electric Reliability Council of Texas — the regional transmission organization managing the Texas interconnection. Structurally isolated from the Eastern and Western US grids, which means Texas data centers have no neighboring interconnect as a backup.

FCF (Free Cash Flow)

Operating cash flow minus capital expenditure. The primary measure of financial health for capital-intensive businesses. FCF at the major hyperscalers has collapsed under the weight of AI infrastructure CapEx in 2026.

FERC

Federal Energy Regulatory Commission — regulates interstate electricity transmission, wholesale electricity markets, and interstate natural gas. FERC Order 1920 (2024) addresses long-term transmission planning.

Glossary Key Terms and Definitions GPU (Graphics Processing Unit) The primary compute hardware for AI training and inference workloads. NVIDIA holds approximately 80% market share. Lead times for H100/B200 class hardware run 36–52 weeks. GPU racks are the primary value concentration at risk in a facility-level loss event.

ICS (Industrial Control System)

The broad category of hardware and software used to control industrial processes — including SCADA, DCS, and PLCs. OT and ICS are often used interchangeably in a security context.

IEC 62443

The international standard for industrial cybersecurity — covering network architecture (zone and conduit), security levels, and lifecycle security requirements for industrial control systems. The primary reference framework for OT security in data center environments.

ISR (Intelligence, Surveillance, Reconnaissance)

Military terminology for pre-attack information gathering. Eighteen named US technology companies have confirmed ISR documentation from PRC-affiliated actors — meaning formal military targeting, not opportunistic intrusion.

IT (Information Technology)

The hardware, software, and systems used for information processing — servers, applications, databases, networks. Distinct from OT (which controls physical processes). Most current cyber security frameworks and insurance products are calibrated for IT, not OT.

KEV (Known Exploited Vulnerability)

A vulnerability documented in the CISA KEV catalog — meaning it has been actively exploited in the wild, not just theoretically identified. 75% of BMS devices carry KEVs, many linked to active ransomware campaigns.

MISO

Midcontinent Independent System Operator — the RTO/ISO serving the Midwest and central US electricity markets, including major data center hubs in Chicago and Columbus. LotL (Living off the Land) An attack technique where adversaries use legitimate system tools and credentials rather than custom malware — making detection by traditional security tools extremely difficult. Increasingly used in OT environments.

NERC (North American Electric Reliability Corporation)

The organization responsible for the reliability of the North American bulk power system. Publishes NERC CIP (Critical Infrastructure Protection) cybersecurity standards — mandatory for BES-connected assets.

NoVA (Northern Virginia)

Northern Virginia — the primary US data center concentration hub, anchored in Loudoun County ("Data Center Alley"). Holds 13% of global live data center capacity and carries 70% of global internet traffic.

OT (Operational Technology)

The hardware and software that monitors and controls physical processes — turbines, cooling systems, power distribution, water treatment, access control, fire suppression. When OT is compromised, physical infrastructure is at risk. Distinct from IT (which processes information).

PJM

PJM Interconnection — the Regional Transmission Organization managing the electricity grid across the Mid-Atlantic, Midwest, and parts of the South, including Northern Virginia. The grid serving the world's largest data center concentration.

PLC (Programmable Logic Controller)

An industrial computer used for automation of electromechanical processes — pumps, motors, valves, conveyor systems. Often used in data center cooling and power distribution systems. 3,900 US Allen-Bradley PLCs are directly internet-exposed via cellular or Starlink connections.

Glossary Key Terms and Definitions PUC (Public Utilities Commission) State regulatory bodies governing electric utility rates and service. Virginia's SCC (State Corporation Commission) approved the GS-5 tariff for large data center loads, effective January 2027.’

PUE (Power Usage Effectiveness)

The ratio of total facility energy use to IT equipment energy use. PUE = 1.0 is perfect efficiency. AI hyperscale DCs target PUE of 1.2–1.4; GPU thermal loads are pushing this metric upward versus CPU-era facilities.

REIT (Real Estate Investment Trust)

A corporate structure that owns income-producing real estate. Major data center REITs — Equinix, Digital Realty, Iron Mountain, QTS — own and lease data center facilities to hyperscalers and enterprise clients.

SCADA (Supervisory Control and Data Acquisition)

An OT system architecture that provides centralized monitoring and control of industrial processes across large geographic areas — power grids, pipelines, water systems. The control layer for grid-connected power infrastructure serving data centers.

SMR (Small Modular Reactor)

Next-generation nuclear reactor designs (under 300 MW) intended for distributed power generation. Growing interest from hyperscalers as a long-term BTM baseload solution. Commercial availability is generally 5+ years away from current major deployments.

Volt Typhoon / Salt Typhoon / Flax Typhoon

PRC-affiliated advanced persistent threat (APT) groups confirmed as operating against US critical infrastructure. Volt Typhoon: pre-positioned in US energy, water, and telecoms for potential conflict. Salt Typhoon: US telecom-espionage campaign — 2025. Flax Typhoon: government and technology targets. VoltRuptor ICS-specific malware confirmed in 2025 — multi-protocol, multi-vendor capability targeting energy sector OT systems. Represents the criminal actor capability escalation to OT-specific tools.

REFERENCES

References — Master Source List [1]–[99]

  1. [1] CISA. “ICS Advisory Program: 2025 Annual Summary.” https://www.cisa.gov/news-events/ics-advisories
  2. [2] Forescout / SC Media. “OT Environment Visibility: <10% Active Monitoring.” https://www.scworld.com/
  3. [3] Claroty. “State of XIoT Security Report 2025.” https://claroty.com/resources/reports/state-of-xiot-security-2025
  4. [4] Cyble. “US Utility Cyberattacks: 689 to 1,162.” https://cyble.com/
  5. [5] CISA / Industrial Cyber. “Ongoing Cyberattacks Targeting PLCs.” https://industrialcyber.co/
  6. [6] Aon. “DCLP Expansion to $3.5B.” https://aon.mediaroom.com/
  7. [7] Munich Re. “Cyber Risk and Insurance Survey 2026.” https://www.munichre.com/
  8. [8] S&P Global. “$10B DC Insurance Premiums 2026.” https://www.spglobal.com/
  9. [9] Parametrix. “45-Minute Outage = $24M.” https://www.parametrixinsurance.com/
  10. [10] Eudaimon. “$20B Demand vs $2.7B Supply.” https://www.eudaimonpartners.com/
  11. [11] Futurum Group. “AI CapEx 2026: $690B Sprint.” https://futurumgroup.com/
  12. [12] CNBC / Evercore ISI. “Big Tech CapEx $1T in 2027.” https://www.cnbc.com/
  13. [13] Goldman Sachs. “$7.6T AI Infrastructure 2026-2031.” https://www.goldmansachs.com/intelligence/
  14. [14] IEA. “Data Centre Electricity Surged 2025.” https://www.iea.org/
  15. [15] Belfer Center / Harvard. “AI, Data Centers, US Electric Grid.” https://www.belfercenter.org/
  16. [16] Epoch AI / RAND. “US 75% Global GPU Performance.” https://epochai.org/
  17. [17] RAND. “AI DC Power Demand 68 GW.” https://www.rand.org/
  18. [18] Dell'Oro Group. “2026 DC Infrastructure Predictions.” https://www.delloro.com/
  19. [19] OpenAI. “Stargate 5 GW Operational.” https://openai.com/
  20. [20] ENR. “Grid Access Bottleneck, Pipeline -50%.” https://www.enr.com/
  21. [21] MultiState. “300+ DC Bills in 30+ States.” https://www.multistate.us/
  22. [22] Measured AI. “Meta Prometheus Tent Structures.” https://measuredai.substack.com/
  23. [23] Swiss Re. “Sigma Jul 2026: DC NatCat.” https://www.swissre.com/
  24. [24] Google / Intersect Power. “$4.75B Energy Parks.” https://www.bloomberg.com/
  25. [25] Brookfield / DOE. “VC Summer Nuclear Restart.” https://www.bloomberg.com/
  26. [26] Waterfall Security. “Threat Report 2026.” https://waterfall-security.com/
  27. [27] Tenable. “DC Security at the Server Rack.” https://www.tenable.com/
  28. [28] Asimily. “IT/OT Convergence in DCs.” https://asimily.com/
  29. [29] IoT Analytics. “DC Trends 2026.” https://iot-analytics.com/
  30. [30] Measured AI. “Four Ownership Models Synthesis.” https://measuredai.substack.com/
  31. [31] Measured AI. “AWS New Carlisle $11B.” https://measuredai.substack.com/p/aws-new-carlisle-data-center-campus
  32. [32] Measured AI. “Microsoft Fairwater Zero Backup.” https://measuredai.substack.com/p/microsoft-fairwater-atlanta-data-center
  33. [33] Measured AI. “xAI Colossus 770K GPUs.” https://measuredai.substack.com/p/xai-colossus-data-center-cluster
  34. [34] Measured AI. “Microsoft Monarch WV.” https://measuredai.substack.com/p/microsoft-monarch-data-center
  35. [35] NERC. “2026 State of Reliability Report.” https://www.nerc.com/
  36. [36] Uptime Institute. “Annual Outage Analysis 2026.” https://uptimeinstitute.com/
  37. [37] Google Cloud. “London Cooling Failure Report.” https://status.cloud.google.com/incidents/
  38. [38] Microsoft. “Azure PIR VVTQ-J98.” https://azure.status.microsoft/
  39. [39] Microsoft. “Azure PIR 2LZ0-3DG.” https://azure.status.microsoft/
  40. [40] Microsoft. “Azure PIR MMXN-RZ0.” https://azure.status.microsoft/
  41. [41] Mordor Intelligence. “Northern Virginia DC Market.” https://www.mordorintelligence.com/
  42. [42] Mordor / DCD. “Loudoun County 199 Facilities.” https://www.datacenterdynamics.com/
  43. [43] Reuters. “NY DC Moratorium Jul 14 2026.” https://www.reuters.com/
  44. [44] DLA Piper. “NY Moratorium Analysis.” https://www.dlapiper.com/
  45. [45] WEF / Mandiant. “Global Cybersecurity Outlook 2026.” https://www.weforum.org/
  46. [46] CISA. “Internet-Exposed ICS +40%.” https://www.cisa.gov/
  47. [47] Cyble. “Energy Ransomware 67%.” https://cyble.com/
  48. [48] CISA/NSA/FBI. “Volt Typhoon Pre-Positioning.” https://www.cisa.gov/news-events/cybersecurity-advisories/aa24-038a
  49. [49] RUSI. “Typhoons in Cyberspace.” https://rusi.org/
  50. [50] CISA. “Workforce Reductions 2025-2026.” https://www.cisa.gov/
  51. [51] Stryker. “Q1 2026 / Handala $317M.” https://www.stryker.com/
  52. [52] DCD/TechTarget. “CloudNordic/CyrusOne/Equinix Ransomware.” https://www.datacenterdynamics.com/
  53. [53] Claroty Team82. “Vertiv UPS + Trane HVAC CVEs.” https://claroty.com/team82/research
  54. [54] ABS Group / NERC. “CIP-003-9 BTM Excluded.” https://www.abs-group.com/
  55. [55] Escher Capital. “Gas 6.5 Bcf/Day by 2035.” https://eschercapital.substack.com/
  56. [56] GE Vernova. “Gas Turbines for DCs.” https://www.gevernova.com/gas-power
  57. [57] Mitsubishi Power. “US Power Outlook.” https://power.mhi.com/
  58. [58] CreditSights. “Largest CapEx Cycle in Tech.” https://www.creditsights.com/
  59. [59] DeNexus. “Q3 2025 OT Incident Analysis.” https://www.denexus.io/
  60. [60] NVIDIA / Jensen Huang. “$100B/GW AI Factory.” https://www.bloomberg.com/
  61. [61] NVIDIA. “FY2026 $193.7B DC Revenue.” https://investor.nvidia.com/
  62. [62] Marsh. “SLA $5M Monthly Penalties.” https://www.theinsurer.com/
  63. [63] BlackRock / Larry Fink. “Compute as Commodity Asset.” https://finance.yahoo.com/
  64. [64] Zurich. “$150M to $3B DC Project Values.” https://riskandinsurance.com/
  65. [65] KKR. “Helix $10B+ Digital Infrastructure.” https://www.kkr.com/
  66. [66] Belfer Center. “Virginia-Texas Case Study.” https://www.belfercenter.org/
  67. [67] DCD. “Virginia GS-5 Rate Class.” https://www.datacenterdynamics.com/
  68. [68] Daily Energy Insider. “Pennsylvania Large Load Tariff.” https://dailyenergyinsider.com/
  69. [69] NERC. “2025 LTRA.” https://www.nerc.com/
  70. [70] Gallagher. “2026 OT/ICS Insurance Outlook.” https://www.ajg.com/
  71. [71] Lockton. “Energy Cyber Risk Advisory.” https://global.lockton.com/
  72. [72] Munich Re / Mosaic. “aiSure Product.” https://www.munichre.com/
  73. [73] Berkshire Hathaway. “Sitting Out DC Cover.” https://www.reinsurancene.ws/
  74. [74] LMA. “War Exclusion LMA5564A-5567A.” https://lmalloyds.com/
  75. [75] Munich Re. “DC Risk $20B TIV.” https://www.munichre.com/
  76. [76] DCD / Uptime. “OVHcloud Strasbourg Fire.” https://www.datacenterdynamics.com/
  77. [77] Morgan Lewis. “AI DC Insurance Considerations.” https://www.morganlewis.com/
  78. [78] WTW. “Insurance Marketplace 2026.” https://www.wtwco.com/
  79. [79] ENR. “DC Construction Risk Uninsured.” https://www.enr.com/
  80. [80] Risk Strategies. “State of the Insurance Market — 2025 Outlook: Cyber.” https://www.risk-strategies.com/blog/state-of-the-insurance-market-2025-outlook-cyber
  81. [81] NERC. “CIP Roadmap 2026.” https://www.nerc.com/
  82. [82] FERC / Swett. “Energized for 2026.” https://www.ferc.gov/
  83. [83] PJM CEO. “Current Situation Not Tenable.” https://www.pjm.com/
  84. [84] EPRI. “Flex MOSAIC DC Grid Flexibility.” https://dcflex.epri.com/
  85. [85] Shieldworkz. “OT Threat Landscape 2026.” https://shieldworkz.com/
  86. [86] Avid Solutions. “Outdated BMS Risk.” https://www.avidsolutionsinc.com/
  87. [87] Waterfall Security. “Securing DC OT Networks.” https://waterfall-security.com/
  88. [88] SecurityWeek. “Cyber Insights 2026 ICS.” https://www.securityweek.com/
  89. [89] SC Media. “Critical Infra Cyber Surge.” https://www.scworld.com/
  90. [90] Hotaling Insurance. “AI DC Hyperscale Risk.” https://www.hotalinginsurance.com/
  91. [91] Insurance Journal. “DC Risk Segmentation.” https://www.insurancejournal.com/
  92. [92] TSMC. “92% Advanced AI Chips.” https://www.tsmc.com/
  93. [93] Nature Sustainability. “AI Server Environmental Impact.” https://www.nature.com/natsustain/
  94. [94] Atlantic Council. “Power Reliability vs Affordability.” https://www.atlanticcouncil.org/
  95. [95] Alphabet/MSFT/AMZN. “Q1 FY2026 Earnings.” Various IR pages
  96. [96] DeNexus. “Hidden Coverage Gap.” https://www.denexus.io/
  97. [97] DeNexus. “Insurability Problem.” https://www.denexus.io/
  98. [98] Resilience Cyber. “Cybersecurity Insurance 2026.” https://www.resiliencecyber.io/
  99. [100] Dragos and Marsh McLennan. “2025 OT Security Financial Risk Report.” https://www.dragos.com/2025-ot-security-financial-risk-report
  100. id="ref-99">[99] Nextgov/FCW; DataCenter Dynamics. “US agencies assessed Salt Typhoon likely hit Digital Realty (CISA assessment).” https://www.nextgov.com
CENTRAL RECOMMENDATION

One Conclusion

Any institution deploying capital into, underwriting debt for, or providing insurance coverage to AI data center infrastructure must answer three questions with evidence: (1) What is the OT-driven loss exposure — expected and tail? (2) What mitigations reduce it, and by how much? (3) What is credibly transferable to insurance, and what remains retained on the balance sheet?
NEXT STEP · DATA CENTER OPERATOR

Quantify the OT-driven loss exposure of your own sites — expected and tail — with DeRISK CRQ, the platform behind the quantification framework this analysis applies. Evidence you can take to your board, your lenders, and your insurers. → denexus.io

NEXT STEP · PE INFRA INVESTOR

Make OT quantification a diligence condition. Before the next AI infrastructure commitment, answer the paper’s three questions with evidence — per site, per portfolio — using the DeRISK platform. → denexus.io

NEXT STEP · LENDER

Underwrite the debt with the OT loss exposure quantified — expected and tail — before capital is committed. DeRISK provides the site-level evidence base the central recommendation calls for. → denexus.io

NEXT STEP · INSURER / REINSURER

“Augment your underwriting team with OT cyber specialist capability — without hiring one.” DeRISK UWA brings OT quantification into the placement workflow — the prerequisite this paper identifies for parametric triggers and timeline-calibrated BI. → denexus.io